Above: Not to be sneezed at: 3D pollen prints for the Met Office (grass, green; oak, yellow and birch, blue).
Disclaimer: If you suffer from hayfever then please avoid spending too long on this page – it may be detrimental to your health!
I bet you didn’t know thatone in five people suffer from hayfever and that 95% of pollen sufferers are allergic to grass pollen in the UK alone? Well neither did I until I visited the Met Office’s pollen forecast website.
It seems that some of the worst offenders are pollen grains from grass, oak and birch which play havoc with the mucous membranes during the pollen season, causing sneezing, nasal congestion, itchy eyes and triggering asthma in susceptible individuals (and to make matters worse, these conditions are exacerbated by drinking alcohol – so no respite there!)
Having read some of our previous blogs (here and here), the Met Office recently asked the Bioimaging Hub if we would generate 3D printed models of some of the worse culprits (shown above) for their outreach & engagement programme to help promote awareness of hayfever.
The 3D prints were generated from surface-rendered confocal microscope volume datasets with help from BIOSI 3D printing. We’ve used the technique to generate physical models of a variety of microscopic samples ranging in size from subcellular organelles to whole developmental organisms. If you’re interested, then further details of the methodology are available below.
Above: ‘Crowning glory’: Webcam shots (1-12)showing stages in the process of 3D printing a giant human molar (left) and the resultant 3D print with support scaffold removed (central and right).
The other day we were presented with a problem: was it possible to generate a 3D model of a human tooth that could be used for dental teaching and outreach purposes? The only thing was, the individual concerned didn’t specify the desired size. With a build volume of 215 x 215 x 300mm and printing resolution of 20-200 microns, our new Ultimaker 3 Extended 3D printer can print BIG, so what better application to put the new instrument through its paces! After a quick search on Thingiverse.com, we downloaded a stereolithography (.stl) file of a human molar tooth segmented from computed tomography (thanks to fvillena). We decided to print it as big as we could, but using the lowest print resolution and lowest level of infill. The results, shown above, are quite impressive – it took approximately 24 hours to print the tooth (crown-side down, root-side up) and with the support scaffold removed resulted in a 3D model approximately 300mm in height – about the same size as tooth from an adult T-Rex!! I suppose we can now be accused of (wait for it…) getting a bit long in the tooth!
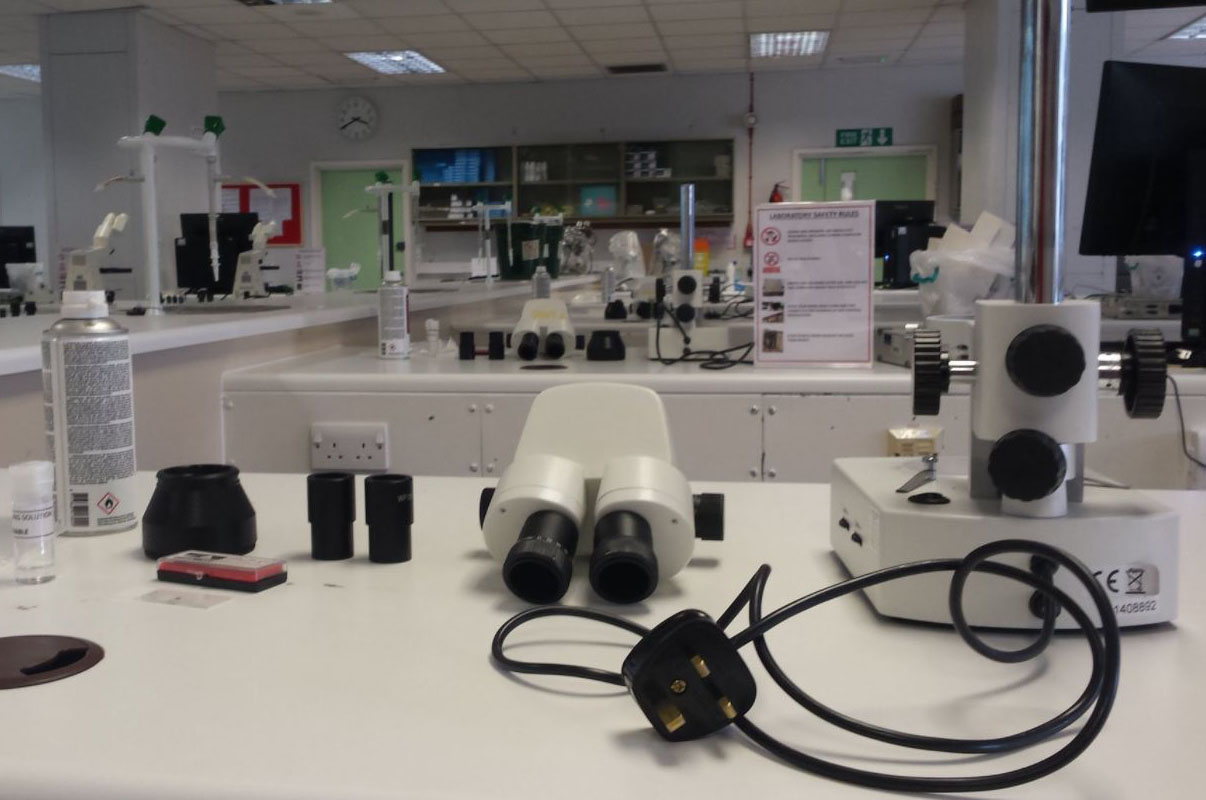
Above: Some of the class microscopes in various states of dismantlement.
It goes without saying, to get the very best out of a microscope you need to know how to optimise and maintain its performance. That said, you’d be surprised just how many microscopists don’t know how to properly set up and maintain their microscopes.
Recently, we run our first microscope maintenance course as part of Cardiff University’s Continuous Professional Development (CPD) programme. We can’t tell you who it was for; but suffice to say, they use microscopes a lot in their work. The two day course covered the basics of light microscopy and the procedures necessary to keep a microscope squeaky- clean and correctly aligned. The practical element of the course saw delegates clean, rebuild and align both upright widefield and stereo-zoom microscopes.
Pleasingly, the course was well-received with very good to excellent feedback. Thanks to all who participated on the two busy but enjoyable days. Thanks must alsogo to our undergrad students for soiling and mis-aligning the microscopes ahead of the course – they did a far better job than we ever could ; )
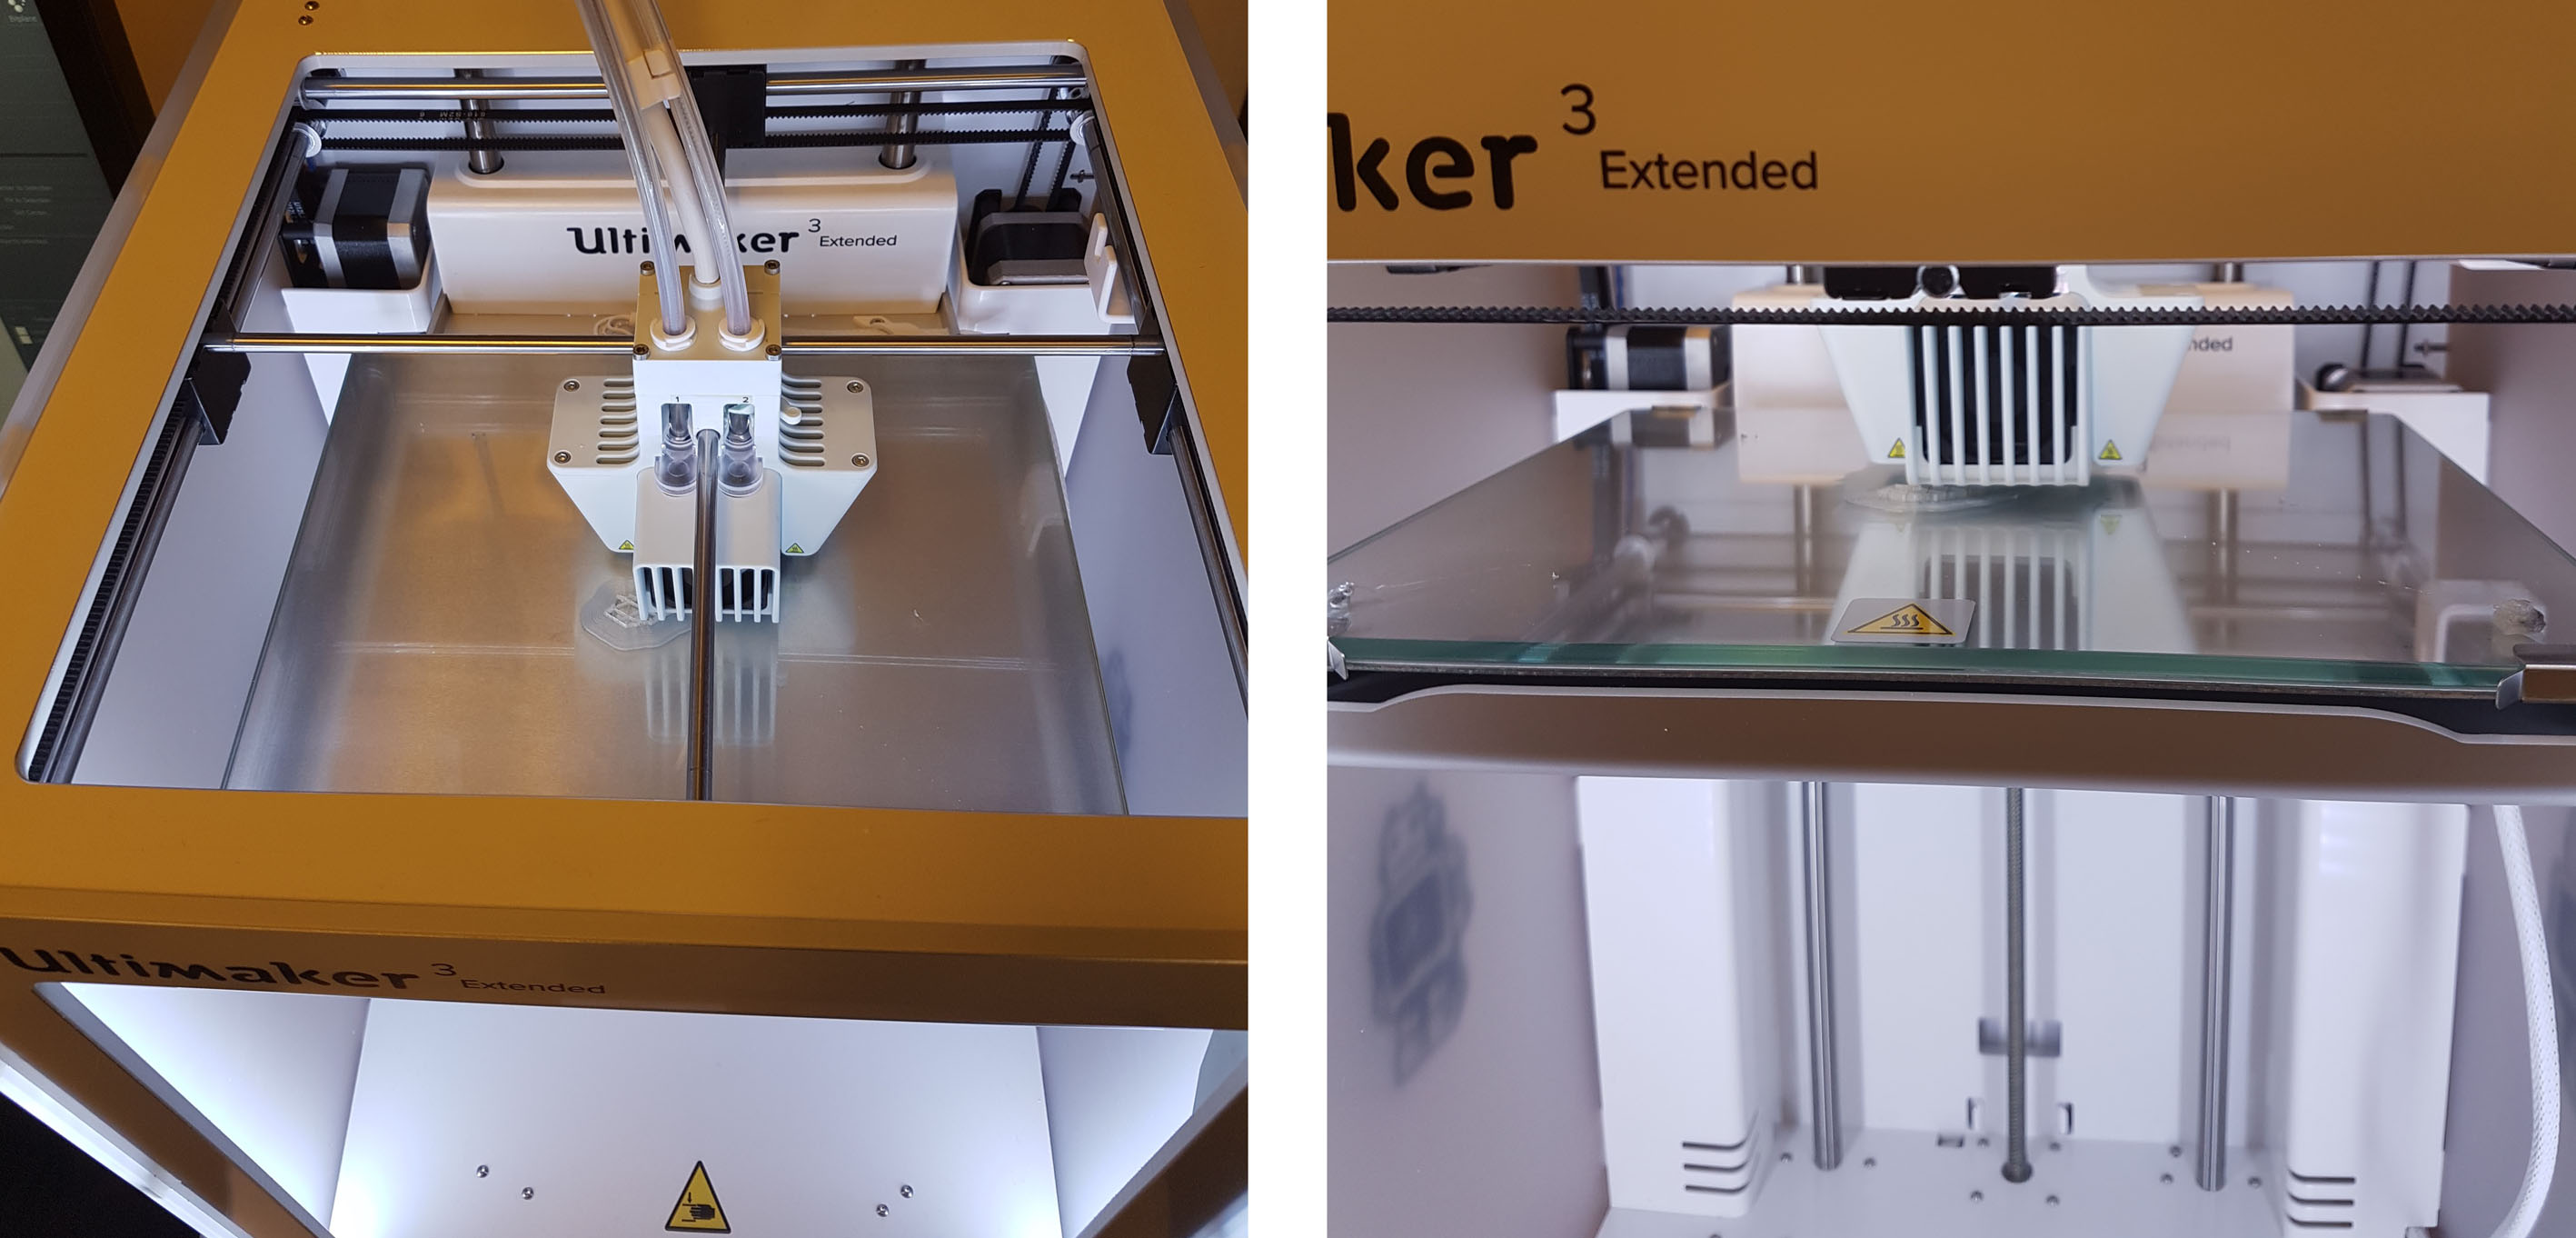
Above: The new Ultimaker ‘Extended’ 3D printer building a stage insert for a novel microscope system.
The Bioimaging Research Hub has recently purchased an Ultimaker 3 ‘Extended’ professional 3D printer. The printer will allow users to 3D print bespoke pieces of scientific equipment or generate scale models of microscopic samples for use in their research as well as for teaching, outreach and engagement activities (examples can be found here andhere).
The 3D printer utilises FDM (Fused Deposition Modelling) printing technology and has a range of advanced features allowing the fabrication of professional quality, high resolution 3D prints. The printer can print in two different colours or a single colour in addition to a dissolvable PVA support scaffold, thus allowing complex overhanging structures to be printed at high fidelity whilst significantly reducing finishing time.
The printer has a large build volume (215 x 215 x 300mm), supports a range of materials (nylon, PLA, ABS, CPE and PVA) and has a print resolution of 20-200 microns. The printer is wi-fi enabled with an internal webcam so that users can remotely monitor the progress of their 3D prints.
Further details of the equipment are available through our equipment database.
Above: Tripping the light fantastic: the new Zeiss Lightsheet Z.1 fluorescence microscope.
A state-of-the-art, Zeiss Lightsheet Z.1 system has recently been installed within the Bioimaging Research Hub (BIOSI 2; E/0.03). The single plane illumination microscope (SPIM) , purchased through generous funding by Cardiff University’s Research Infrastructure Fund (Lead applicant: Dr Pete Watson), allows fast and gentle multi-channel 3D/4D fluorescence imaging at the sub-cellular level. The system offers the potential of whole organ imaging of fixed cleared samples and can provide an unprecedented insight into developmental processes occurring in live model organisms such as Arabadopsis thaliana (Thale Cress), Danio rerio (Zebrafish) and Drosophila melanogaster (Fruit fly), and in vitro organoid at a high spatio-temporal resolution. Further information about this system is available via the Bioimaging Hub equipment database.
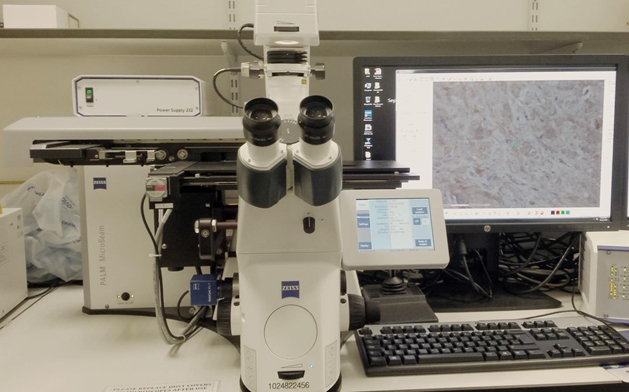
Above: ‘Cutting-edge’ equipment: the Zeiss PALM MicroBeam laser micro-dissector located at the European Cancer Stem Cell Research Institute (ECSCRI)
A Zeiss PALM MicroBeam laser micro-dissector system is now available as a spoke of the Bioimaging Research Hub. The equipment, which is located at the European Cancer Stem Cell Research Institute (ECSCRI), allows isolation of DNA, RNA and protein from laser micro-dissected samples from both histological sections (paraffin wax or cryo) and live cells. Further details of the system are available through our equipment database. All enquiries for this system should be directed towards Mr Mark Bishop.
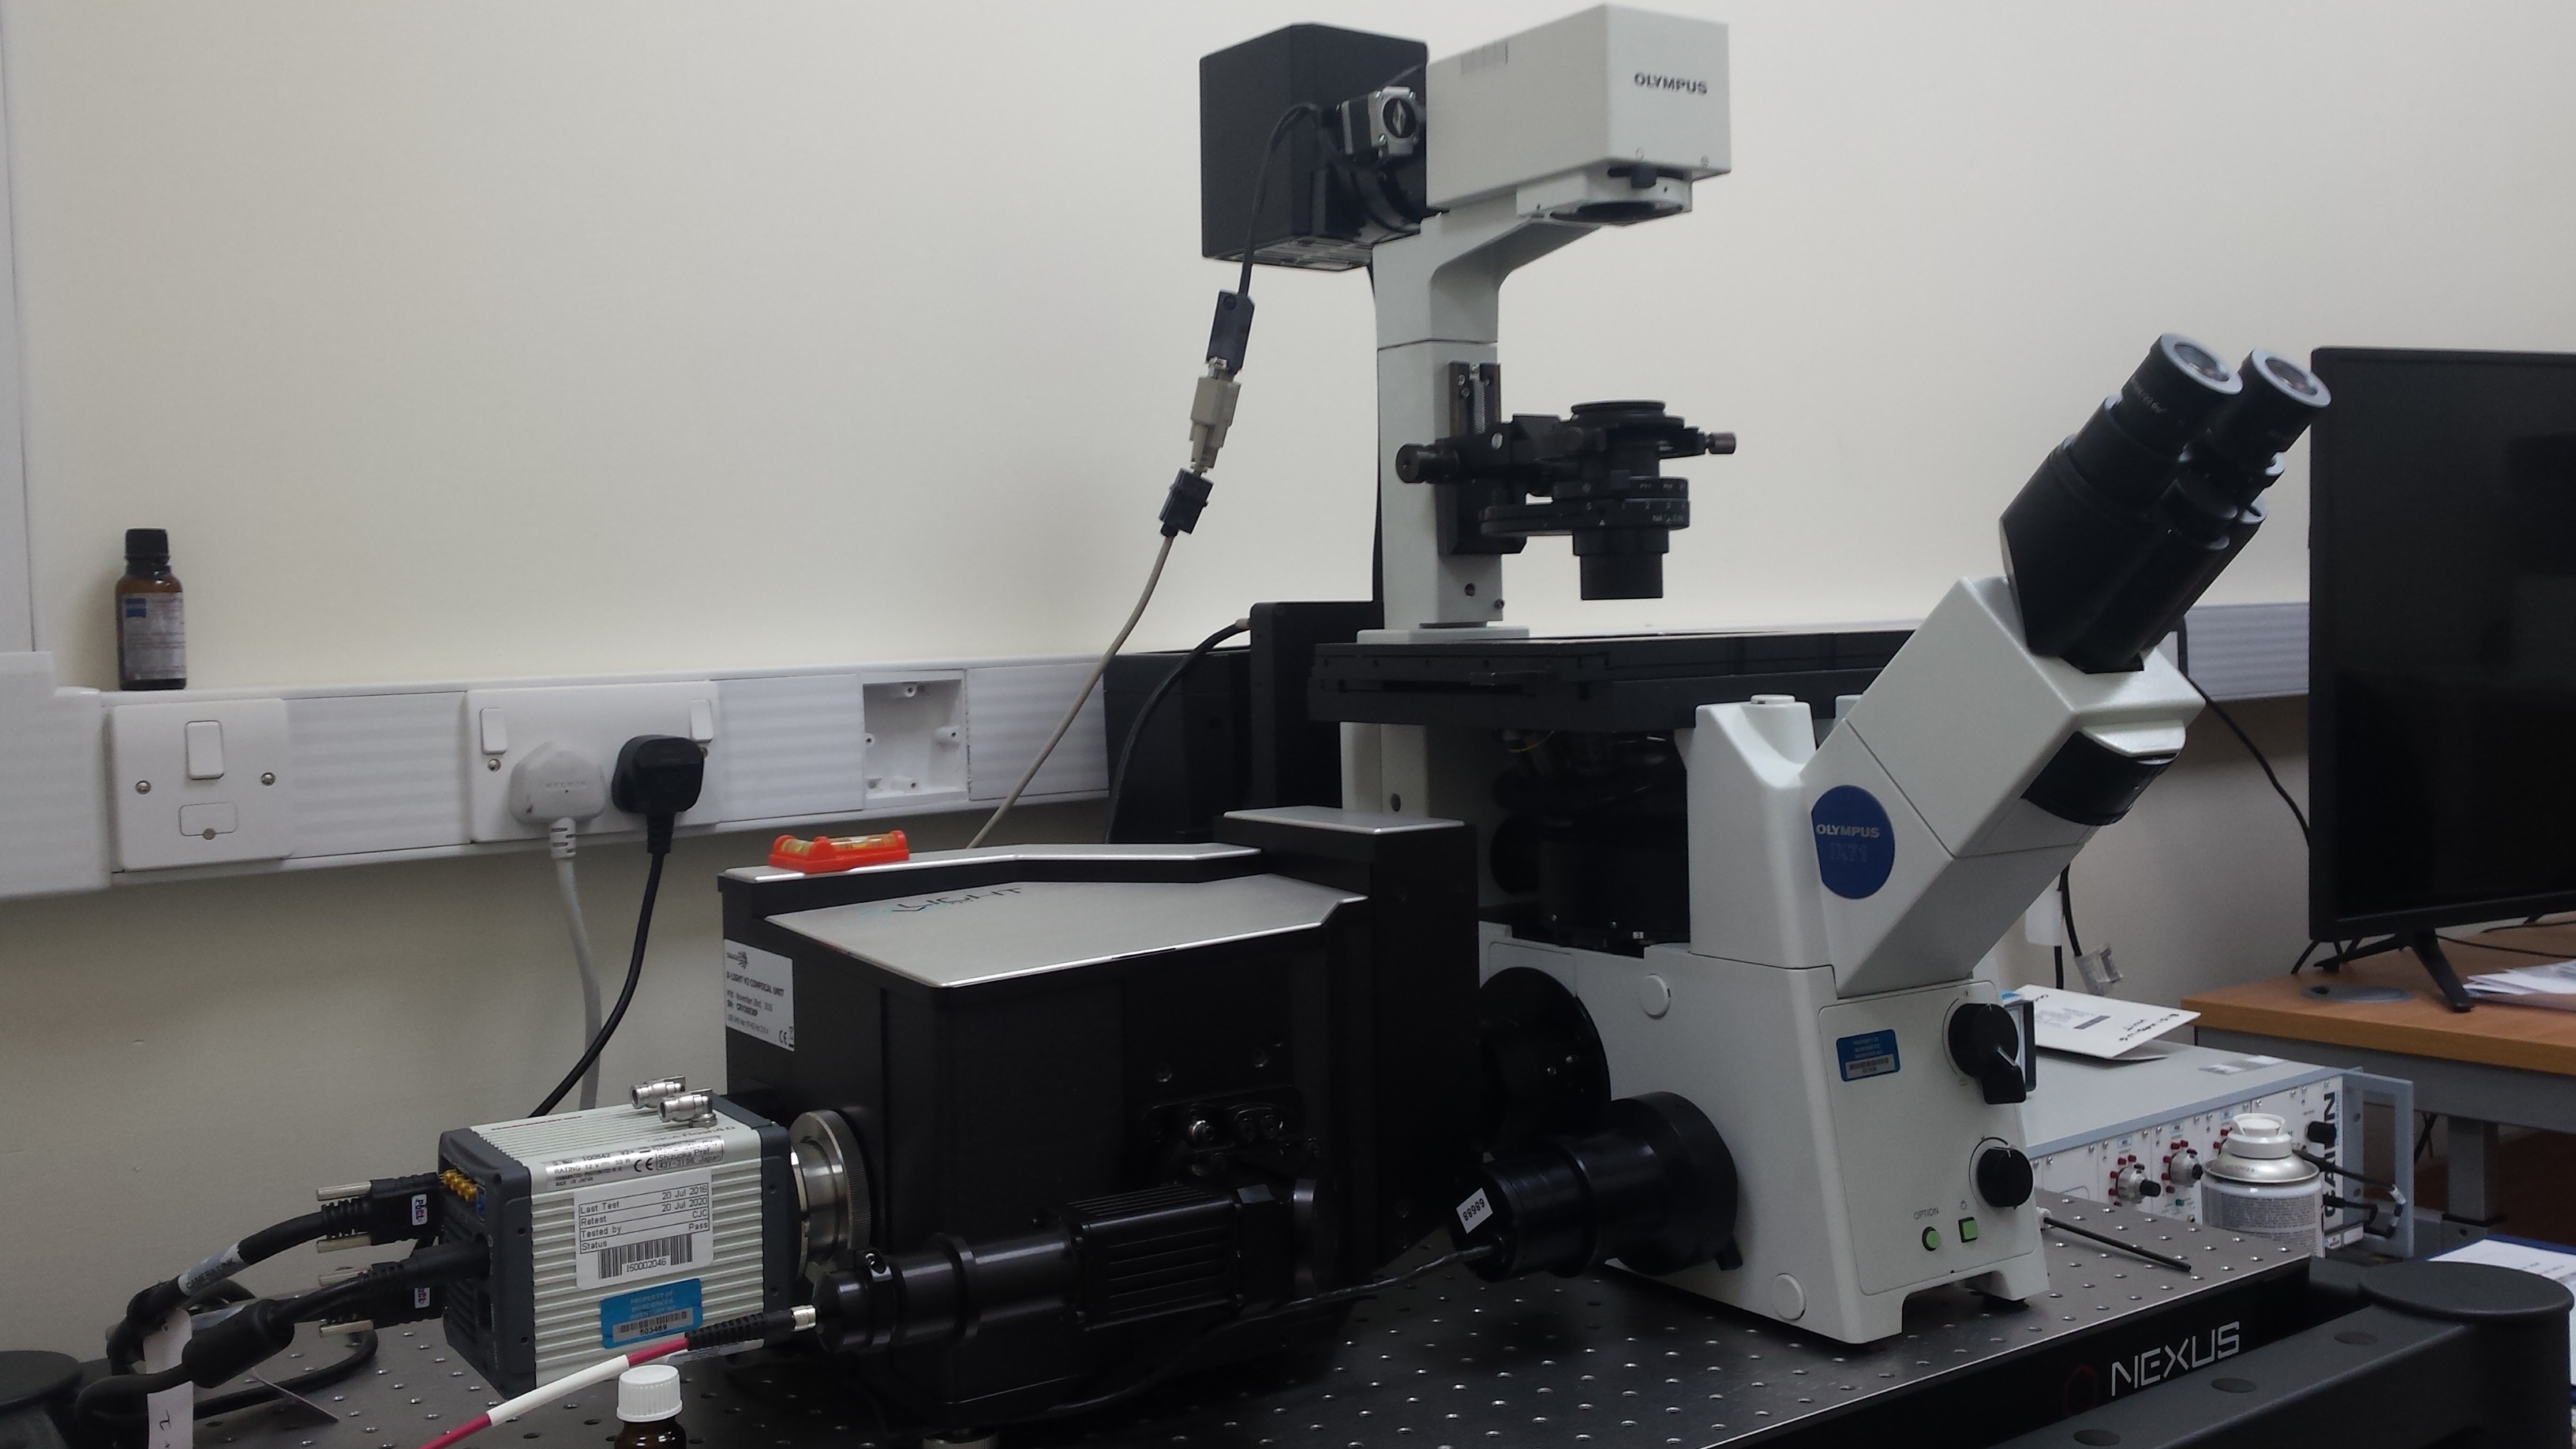
The old electron microscopy darkroom (BIOSI 2; E/0.05) within the Bioimaging Research Hub has recently been refurbished as a live cell imaging suite via generous support from BIOSI. It now houses a spinning disc confocal system for fast, live cell imaging applications. The system is based around an Olympus IX71 inverted microscope, kindly provided by Dr Pete Watson, which has been upgraded, via ISSF funding, with a Crest Optics X-Light V2 confocal head, a Cairn Research tri-line laser bank (405nm, 488nm, 561nm) and a Hamamatsu ORCA Flash 4 sCMOS digital camera with M-View Gemini image splitter. The system is fully integrated via Molecular Devices MetaMorph software and boasts a 40″ 4k display. The system will expand the Hub’s imaging toolbox, enabling high speed, multi-position, multi-colour 3D/4D image acquisition. Support systems for live cell imaging (i.e. gas and incubation) are also available within the facility. Further details of this system are available through our equipment database.
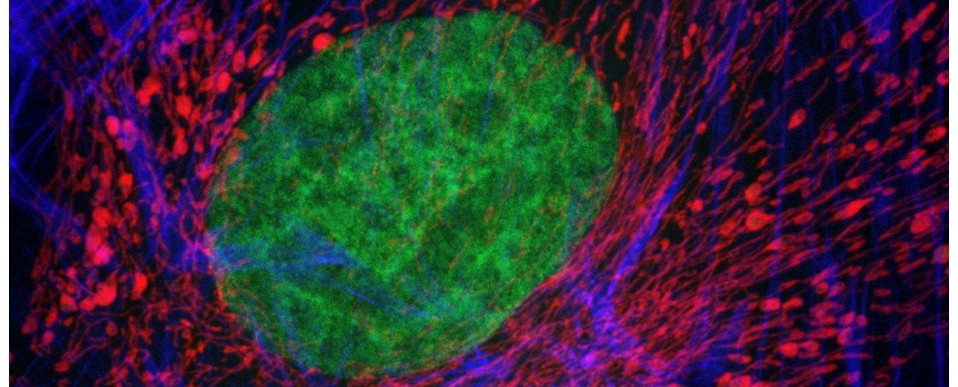
Above: Autofluorescence from mixed connective tissues imaged by confocal microscopy (left). The autofluorescent emissions can be spectrally-resolved through wavelength scanning (right). Excitation at 488nm.
Whilst autofluorescence from endogenous fluorophores can reveal much about the biochemical composition of a sample, it can also hamper the microscopic detection of targeted fluorochromes if they emit light at the same wavelengths as endogenous fluors. Indeed, without proper controls, complex background autofluorescence can lead to misinterpretation of image data and generation of false positive results.
Autofluorescence derives from multiple sources within the sample – the main culprits are NADH and NADPH, lipofuscins, flavins, elastin and collagen (and lignin and chlorophyll in plants). The excitation and emission ranges of the worst offenders have been shown below. It follows that tissues with high collagen and elastin contents, e.g. skin, tendon and cartilage, autofluoresce very brightly; as do tissues that are rich in metabolic breakdown products such as lipofuscin, e.g. liver, spleen etc.
Adding to the problem is the effect of chemical fixatives (e.g. formalin, glutaraldehyde etc) and solvents used to preserve tissue architecture for microscopy: the cross-linkages generated by these chemicals increase autofluorescence, which can be worsened further by long-term storage of the fixed processed tissues.
So, dear reader, here’s some simple advice on steps that you can take to address this common problem:
1. Include an unlabelled control to evaluate the level of autofluorescence within your sample.
Observation of unlabelled samples through RGB fluorescent filters (note their transmission characteristics) will help identify where in the visible spectrum the autofluorescent signal is brightest.
Spectral (lambda, wavelength) scanning will allow you to precisely identify the fluorescent emission spectra from endogenous fluorochromes and can help separate their emissions from those of your fluorochrome (see above figure).
2. Select fluorochromes that are outside the range of the autofluorescence.
If the autofluorescence signal is high in the blue, then move into the green; if it’s high in the green, move into the red – or better still, the far red (if your system can detect in this range).
Use modern fluorescent probes (e.g. Alexa Fluor, Dylight, or Atto range) instead of first generation fluorochromes. They are brighter, more photo-stable and have narrower excitation and emission bands. They are also available in variants that span the near UV, visible and far red range of the spectrum, affording you plenty of choice.
3. Use a microscope with filters optimised for your choice of fluorochromes.
Band-pass filters which collect emissions within a specific range may be more useful than long-pass filter sets which collect all emissions past a certain wavelength. The narrower the range of the band-pass filter, then the better it can separate fluorophores with close emission spectra.
4. If the autofluorescence is unevenly distributed within your sample, use targeted microscopy to avoid it.
5. If you can’t avoid the autofluorescence, then take measures to remove or reduce it.
Analyse the pixel intensity distribution within your image and try thresholding out the lower intensity autofluorescence signal.
Pre-bleach your samples in a light box using a high intensity illumination source prior to fluorescent labelling (see below reference)
Treat samples with a chemical reagent (e.g. sodium borohydride, Sudan black B, ammonium ethanol etc) to reduce background autofluorescence (see below reference)
6. If all else fails, consider the following:
use cryoprocessed material as an alternative to chemical fixation and paraffin wax processing.
avoid long term storage of material/archival tissue samples.
try a different detection modality (e.g. immunoperoxidase instead of immunofluorescence)
Above: Photo-bleaching (fading) occurs when a fluorochrome permanently loses the ability to fluoresce due to photon-induced chemical damage and covalent modification.
Hands up if you’ve spent hours preparing a sample for fluorescence microscopy only to see the signal disappear before your eyes upon excitation? Frustrating eh (unless, of course, FRAP is your objective)? Well here’s some simple and sound advice on how you can minimise photo-bleaching and get the best out of your samples under the fluorescence microscope.
1. Visualise your samples immediately after fluorescent labelling – this is when they are at their brightest.
If this is not possible then loosely wrap your samples in aluminium foil and keep them in the dark at 4oC until you get the opportunity to image them.
2. Minimise their exposure to light in order to reduce photo-bleaching.
visualise your samples under low light conditions.
use transmitted light to find a region of interest (ROI) and then switch to epifluorescence observation – avoid dwelling too long on the ROI.
step down the intensity level of excitation light or insert a neutral density filter into the light path.
set up imaging parameters on a neighbouring region and then return to the ROI for image capture.
use image binning to reduce exposure time.
use the microscope shutter to switch off the light source between images.
create a photo-bleach curve from a timed series of images. This can be used to normalise for loss of fluorescence intensity.
3. Switch to a mounting medium with anti-fade protection e.g. Vectashield, Prolong Gold/Diamond, SlowFade Gold/Diamond. These work by reducing the oxygen available for photo-oxidation reactions, thus reducing photo-bleaching. N.B. Many of these are available with a nuclear counterstain (e.g. Dapi) included in the formulation. Alternatively, make your own anti-fade reagent (instructions below).
4. Switch to brighter, more photo-stable fluorochromes. First generation fluorochromes such as FITC and TRITC photo-bleach readily (and are pH sensitive) thus should be replaced with modern dyes such as the Alexa Fluor, Dylight, or Atto range of fluorochromes, which are much brighter and far more photo-stable.
Above: surface-rendered confocal reconstructions of pollen samples (left) and their corresponding 3D printed models (right).
Isn’t the World Wide Web a wonderful thing? Not so long ago I wrote a short blog explaining how we had developed methodology to convert volume datasets from the confocal microscope into 3D printed models – perfect solid scale replicas of samples the size of a pollen grain etc. Well, shortly afterwards I received an email from someone who had not only read the blog but, serendipitously, wanted to do this very thing! What is more, she was located not a million miles away: in fact, little more than 400 yards down the road from us, working as a researcher within Cardiff University’s School of History, Archeology & Religion. Please excuse the pun, but it really is a small world!
Rhiannon Philp is an archaeologist – or palynologist to be precise – someone who studies ancient pollen grains and spores found at archaeological sites. Pollen extracted from archeological digs can be used for radiocarbon dating and for studying past climates and environments by identifying plants growing at the time. Rhiannon is using this information to develop an understanding of prehistoric sea level changes in South Wales as part of the Changing Tides Project.
Rhiannon asked if we could generate a reference collection of 3D pollen prints that could be used for teaching and outreach activities as part of a new Archaeology engagement project called Footprints In Time. Indeed, some of her pollen samples were from sites containing both human and animal footprints made over 5000 years ago!
You can see some of our results above: on the left are the surface-rendered confocal volume reconstructions and, on the right, their corresponding 3D printed facsimiles – courtesy of the BIOSI 3D printing facility.
If you’re at the National Eisteddfod in Abergavenny this week (29th July – 6th August), then please pop by to see Rhiannon’s stall within the Cardiff University tent – all of the models will be on display there, together with a lot more. Any further interest, then please get in touch.
 Above: Not to be sneezed at: 3D pollen prints for the Met Office (grass, green; oak, yellow and birch, blue).


![[Parameter-Settings] FileVersion = 2000 Date/Time = 0000:00:00 00:00:00 Date/Time + ms = 0000:00:00,00:00:00:000 User Name = TCS User Width = 1032 Length = 1032 Bits per Sample = 8 Used Bits per Sample = 8 Samples per Pixel = 3 ScanMode = xy Series Name = demo2.lei](http://blogs.cardiff.ac.uk/bioimaging/wp-content/uploads/sites/492/2016/09/Photobleach.jpg)

