We’ve had a Zeiss Lightsheet Z.1 system in the Bioimaging Hub for a little while. In the main, the system has been used to examine small developmental organisms (e.g. zebrafish larvae) and organoids that can be introduced into the lightsheet sample chamber via thin glass capillary tubes (0.68-2.15mm diameter) or via a 1 ml plastic syringe. This is accomplished by embedding the sample in molten low melting point agarose, drawing it into the capillary tube/syringe and then, once the agarose has set, positioning the sample into the light path by displacing the solid agarose cylinder out of the capillary/syringe via a plunger.
To support a new programme of research, the Bioimaging Research Hub recently purchased a state of the art X-CLARITY tissue clearing system. This allows much larger tissue and organ samples to be rendered transparent quickly, efficiently and reproducibly for both confocal and lightsheet microscopy. Unfortunately, due to their larger size, the samples cannot be introduced into the lightsheet sample chamber via the procedure described above. In this technical feature we have evaluated a range of procedures for lightsheet presentation of large cleared mammalian tissues and organs.
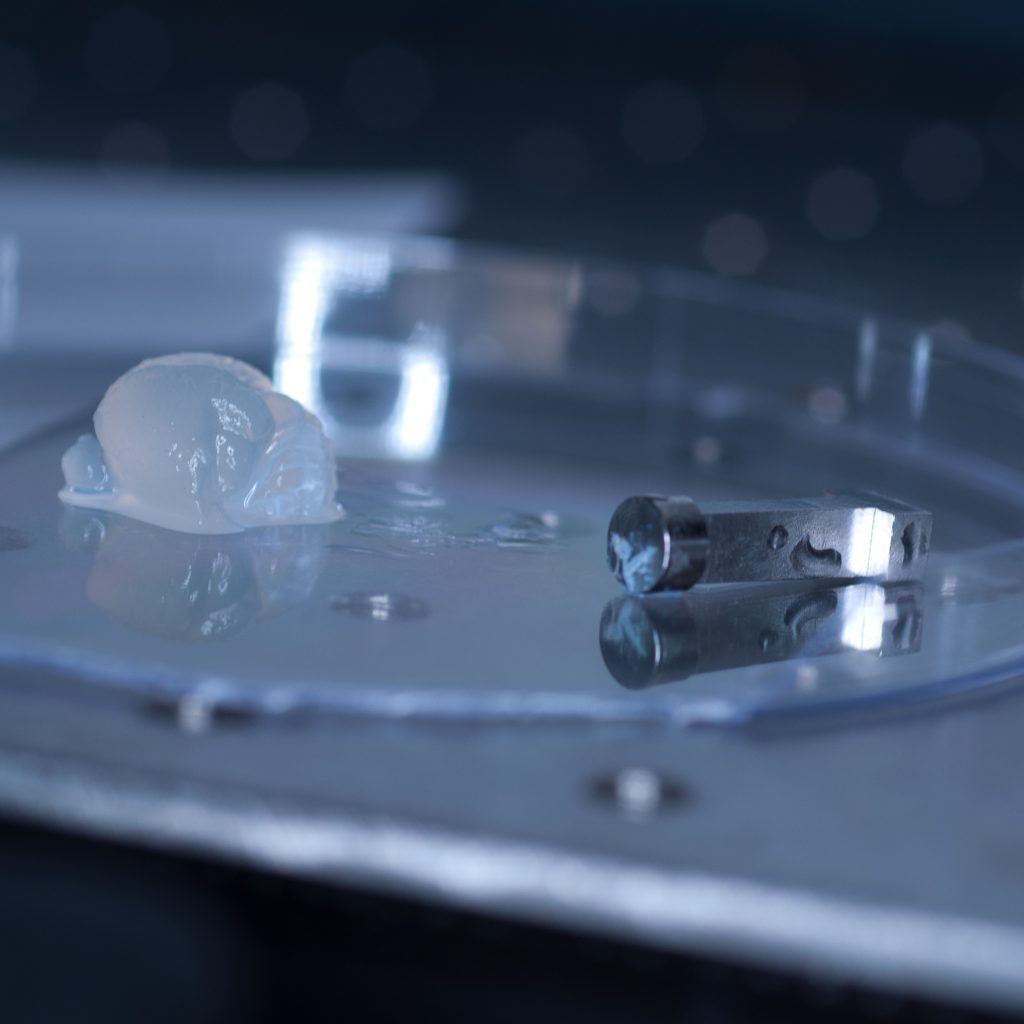
The test sample we received in PBS had been processed by a colleague using the X-CLARITY system using standard methodologies recommended by the manufacturer. The tissue was completely transparent after clearing, however its transferal to PBS (e.g. for post-clearing immuno-labelling) resulted in a marked change in opacity, the tissue becoming cloudy white in appearance. We thus returned the sample to distilled water (overnight at 4oC) and observed a return to optical clarity with slight osmotic swelling of the tissue.
Above: The cleared sample has a translucent, jelly-like appearance.
Generally, cleared tissue has a higher refractive index than water (n=1.33) and X-CLARITY tissue clearing results in a refractive index close to 1.45. To avoid introducing optical aberrations that can limit resolution, RI-matching of substrates and optics is recommended. Consequently, our plan was to transfer the cleared tissue into X-CLARITY RI-matched (n=1.45) mounting medium and set up the lightsheet microscope for imaging of cleared tissues using a low power x5 detection objective (and x5 left and right illumination objectives) which would allow us to capture a large image field.
Prior to fitting the x5 detection objective an RI-matched spacer ring (see below) was first screwed into the detection objective mount.
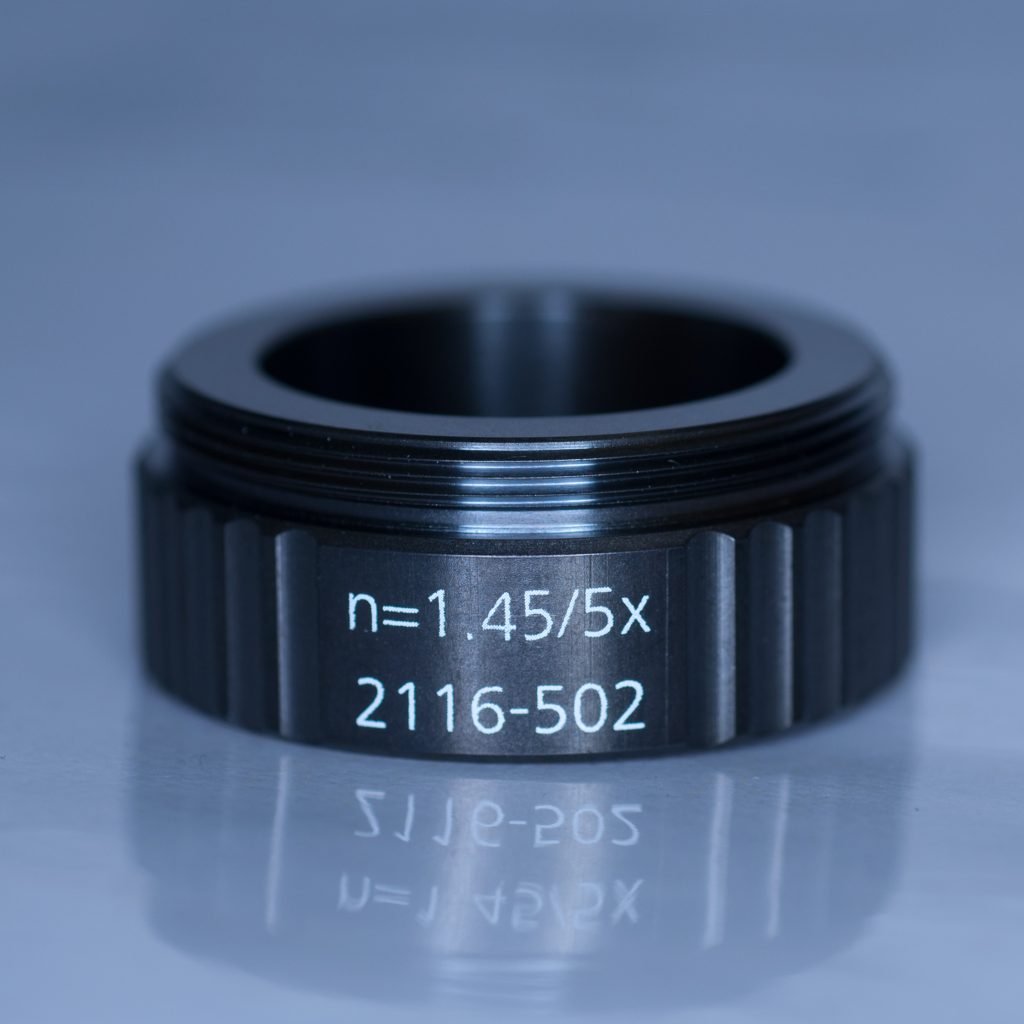
Above: Spacer ring for n=1.45 lenses.
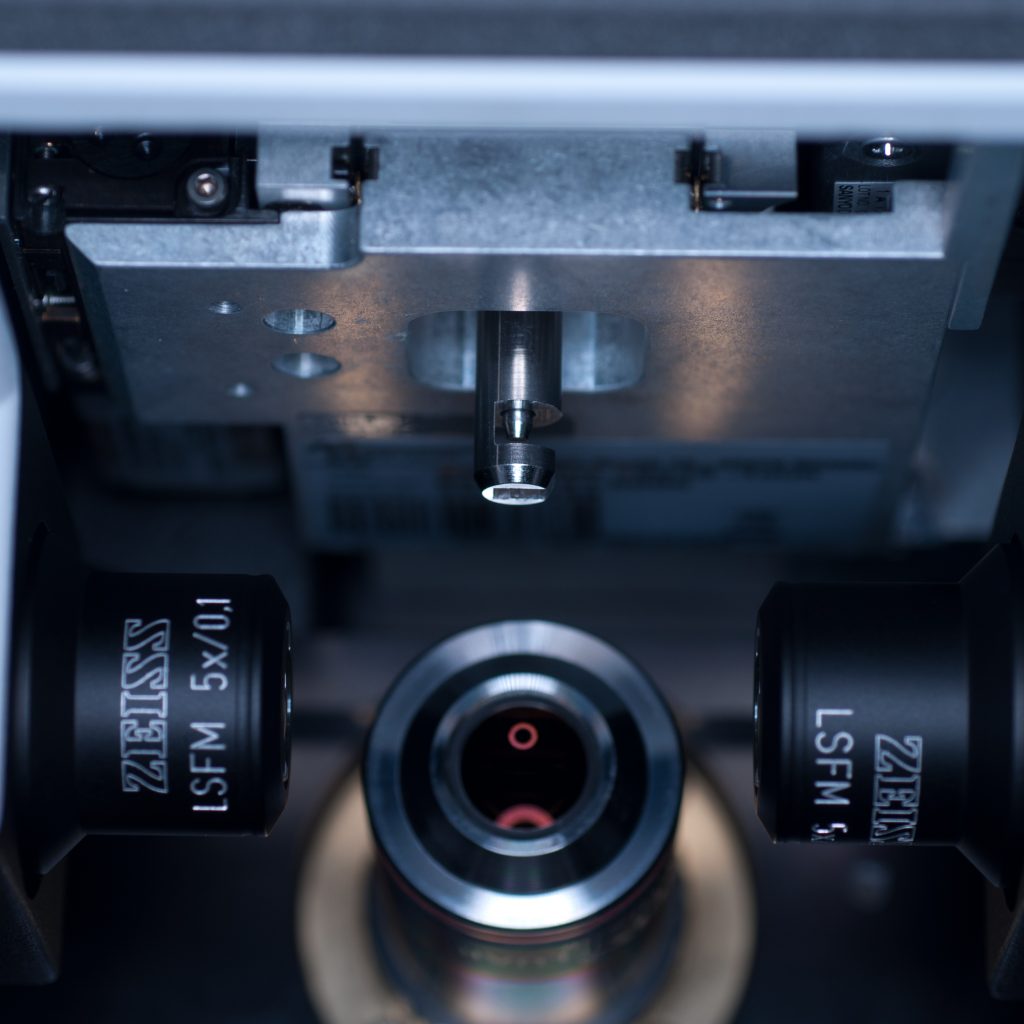
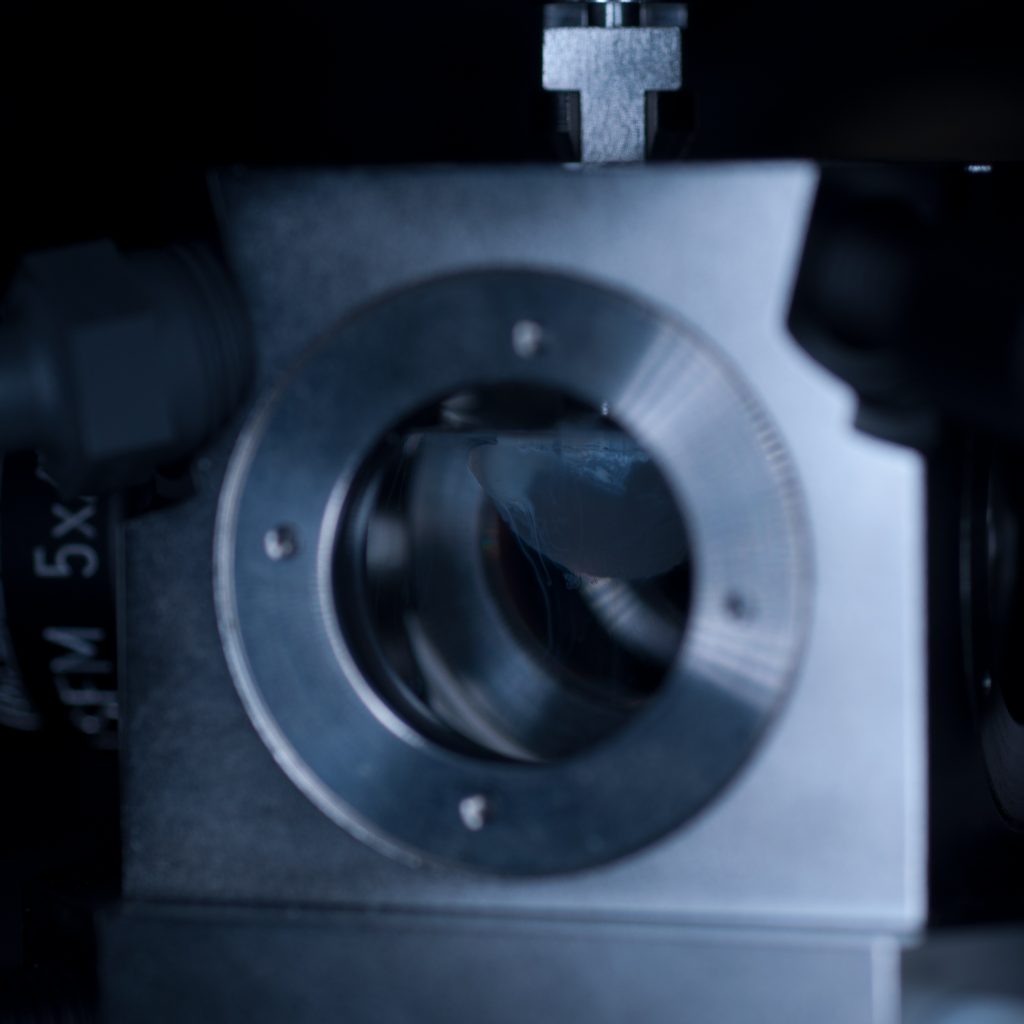
After the n=1.45 spacer ring was fitted, the x5 detection objective was screwed into place (seen centrally in below image) followed by the x5 illumination objectives to the left and right (see below).
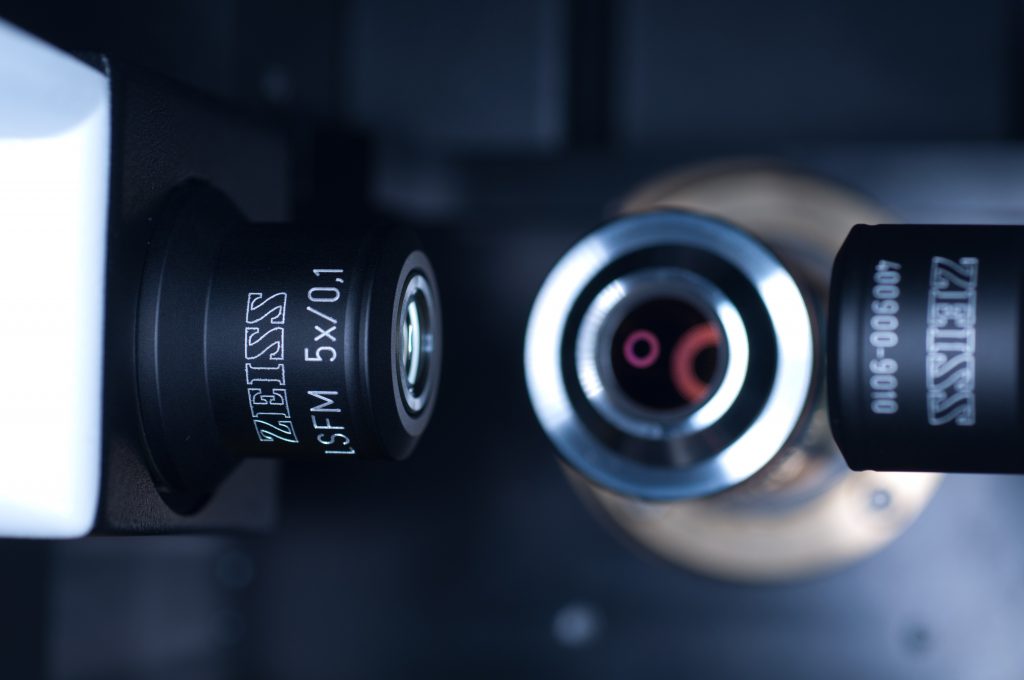
Above: Light sheet objectives. Illumination on left and right, observation to the rear.
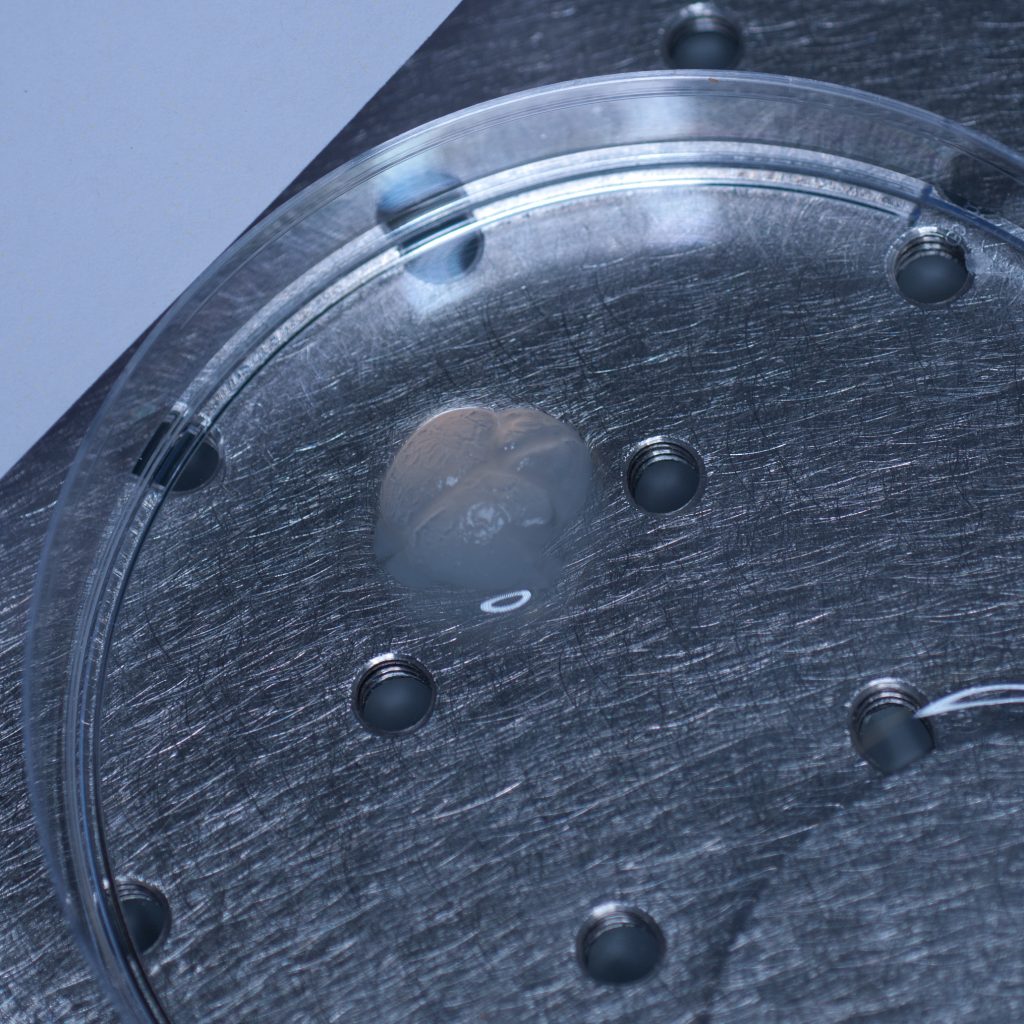
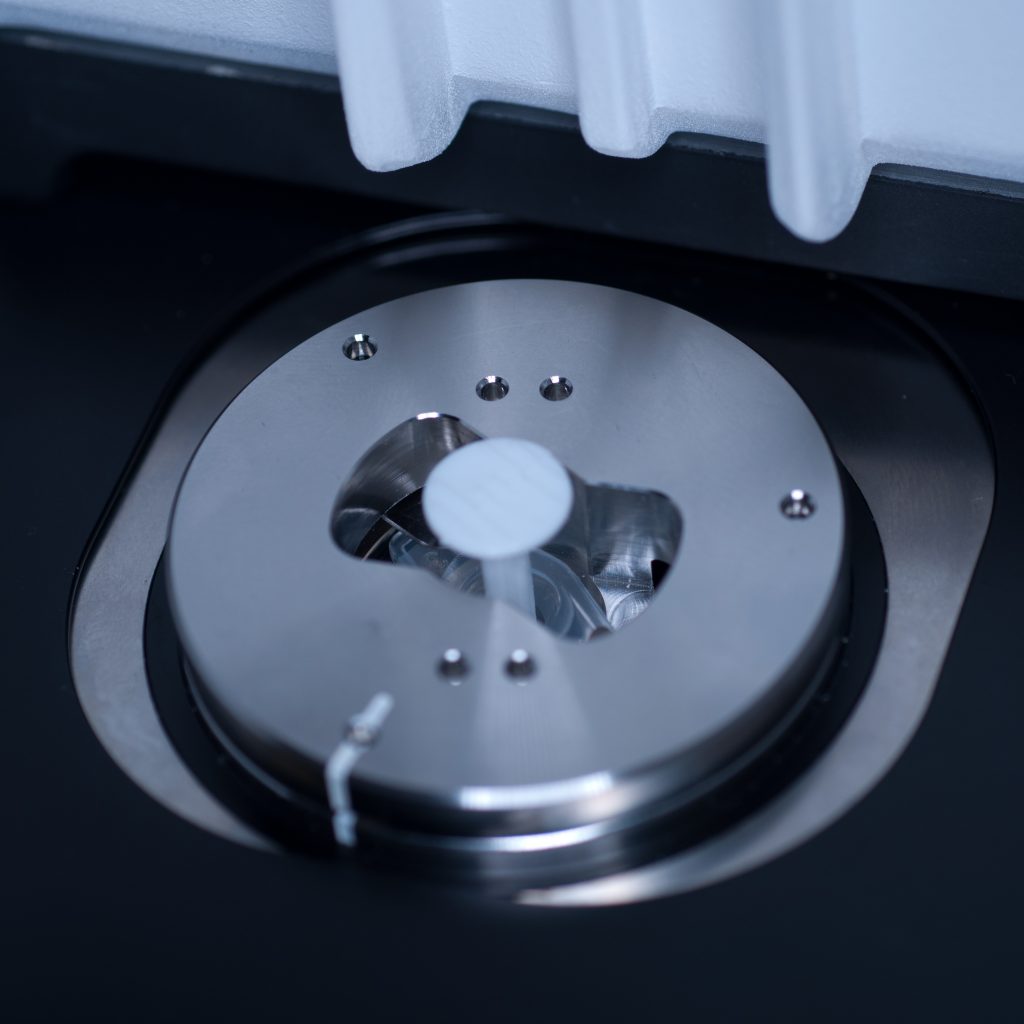
Once the objective lenses had been screwed into place, the sample chamber was inserted (see below). The use of a clearing mountant requires a specific n=1.45 sample chamber. We used the n=1.45 chamber for the x5 (air) detection objective. This chamber has glass portals (coverslips) on each of its vertical facets (unlike the x20 clearing chamber that is open at the rear to accomodate the x20 detection lens designed for immersion observation).
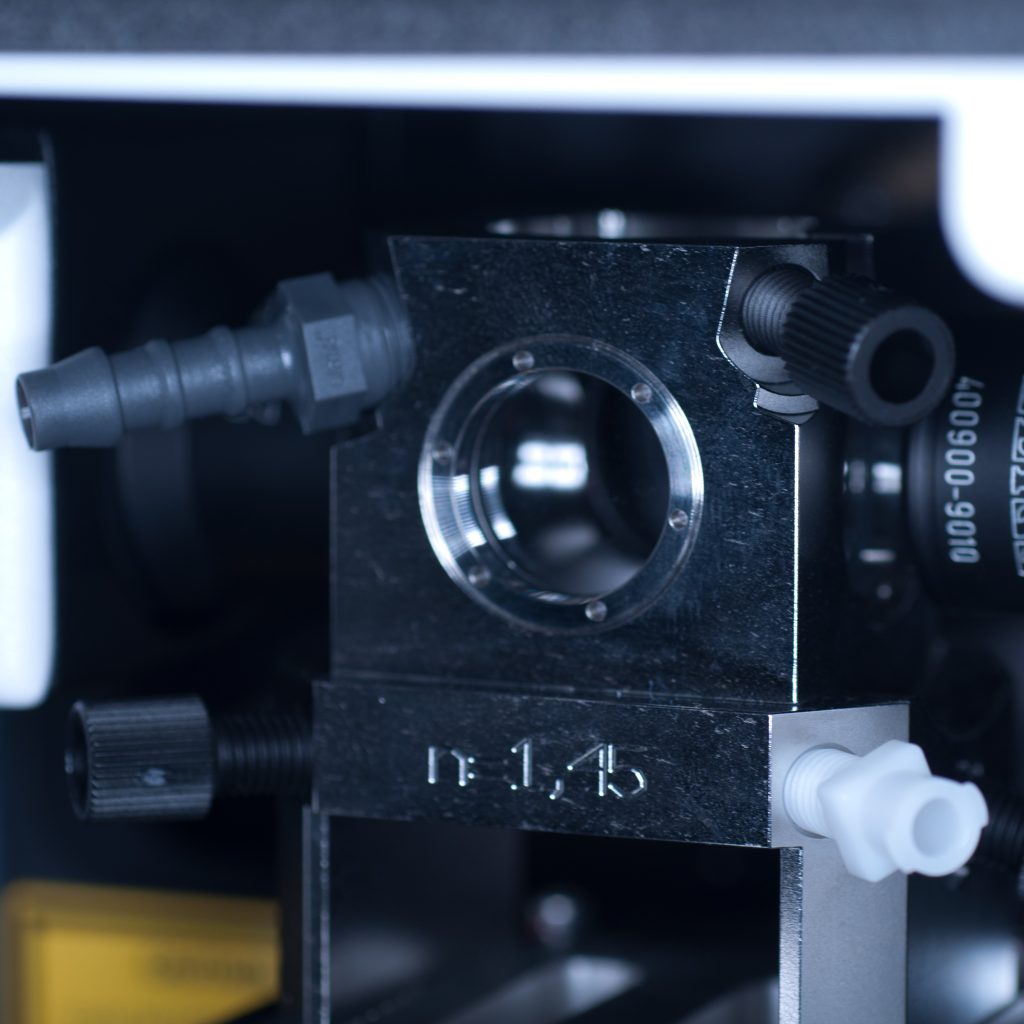
Above: Sample chamber for clearing (n=1.45).
Unfortunately, as it turned out, the RI-matched X-CLARITY mounting medium for optimum imaging of X-CLARITY cleared samples wasn’t available to us on the day, necessitating a quick re-think. As the tissue sample remained in distilled water we decided to image, sub-optimally, in this medium. To do this we quickly swapped the n=1.45 spacer ring on the detection objective to the n=1.33 spacer. We then switched to the standard (water-based) sample chamber.
With the system set-up for imaging we set about preparing the tissue sample for presentation to the lightsheet. As mentioned earlier, large tissue samples cannot be delivered to the sample chamber from above, as the delivery port of the specimen stage has a maximum aperture of 1cm across. This necessitates (i) removing the sample chamber (ii) introducing the specimen holder into the delivery port, (iii) manually lowering the specimen stage into place (iv) attaching the sample to the specimen holder (v) manually raising the specimen stage, (vi) re-introducing the sample chamber, and then (vii) carefully lowering the specimen into the sample chamber which can then (viii) be flooded with mounting medium.
The initial idea was to present the sample to the lightsheet, as described above, by attaching it to a 1ml plastic syringe. The syringe is introduced into the delivery port of the lightsheet via a metal sample holder disc (shown below).
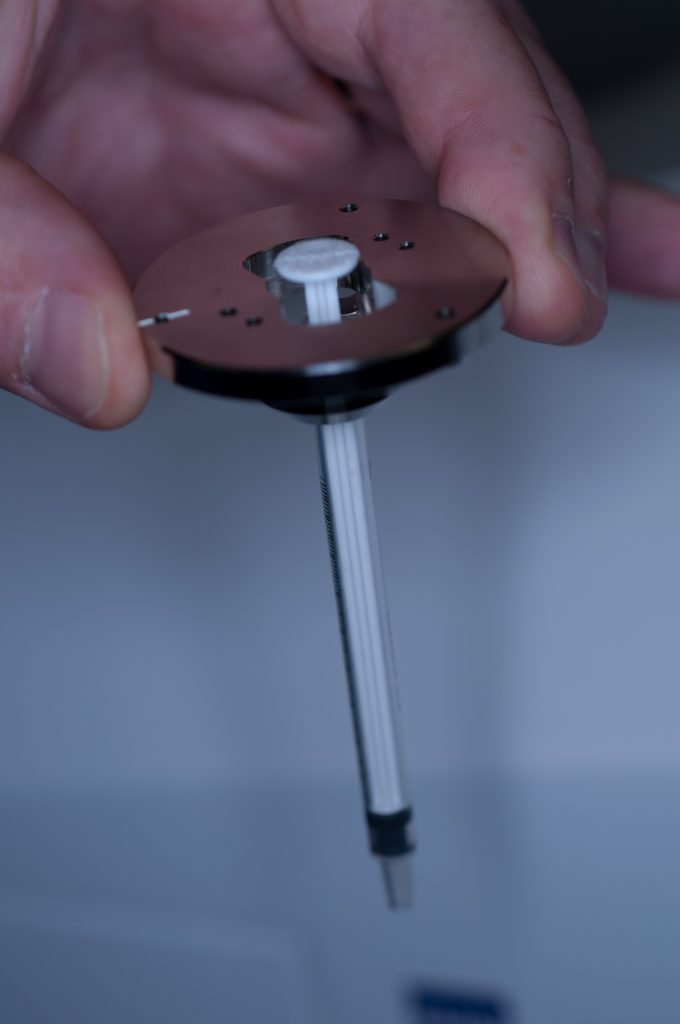
Above: Holder for 1mm syringe.
The syringe is centred in the sample holder disc via a metal adaptor collar (shown below), which must be slid along the syringe barrel all the way to its flange (finger grips). When we tried this using the BD Plastipak syringes supplied by Zeiss we found that the barrels were too thick at the base so that the the collar would not sit flush with the flange!
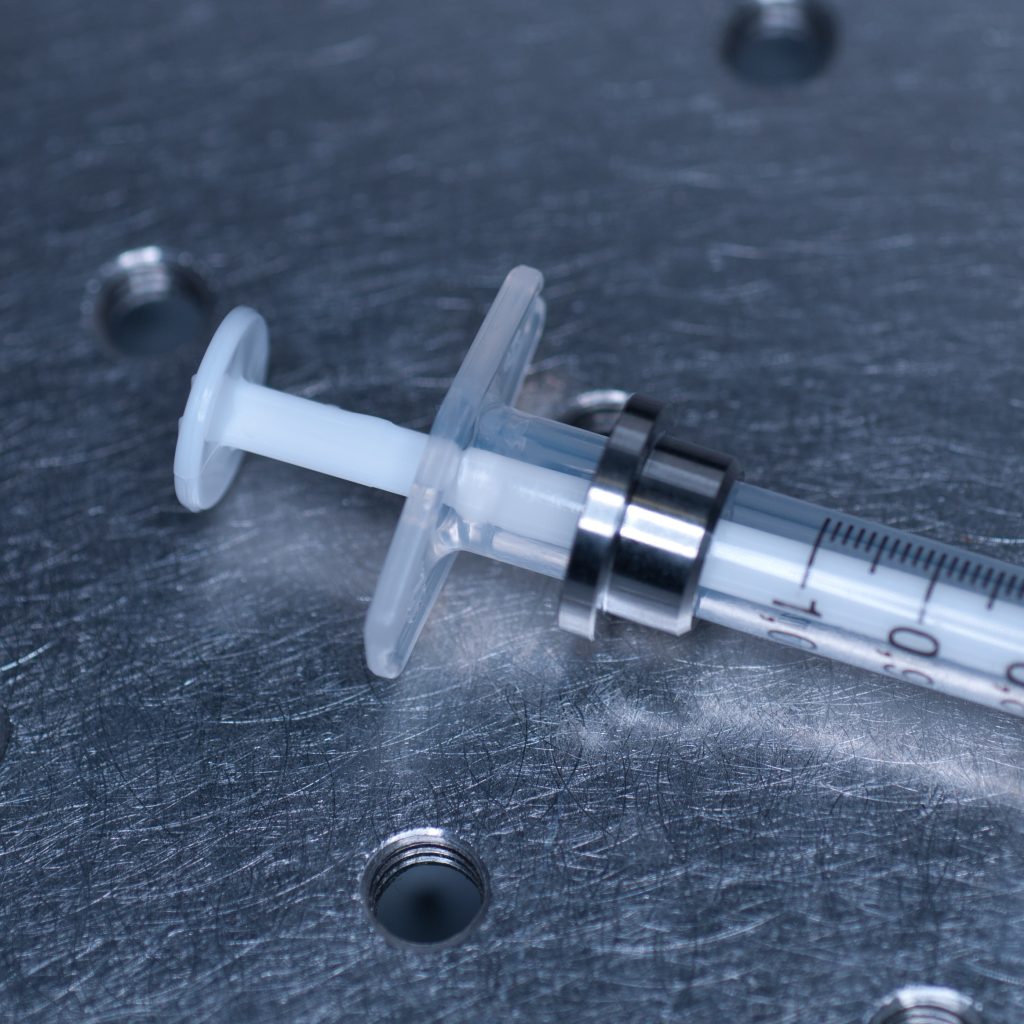
Above: Metal collar for the syringe holder.
In order to make it fit, we carefully shaved off the excess plastic at the base using a razor blade.
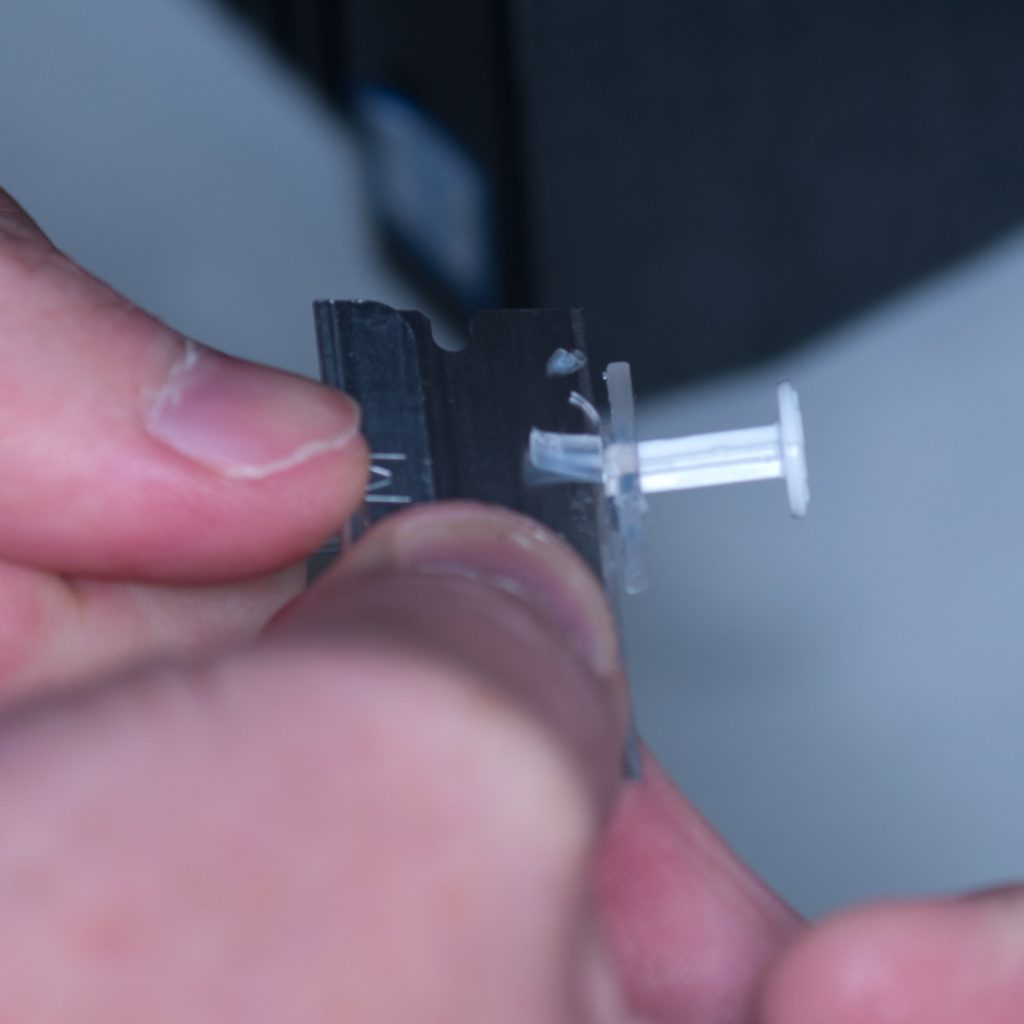
Above: Carefully shaving plastic off the syringe to make it fit.
This allowed the adaptor collar to be pushed flush against the barrel flange (see below).
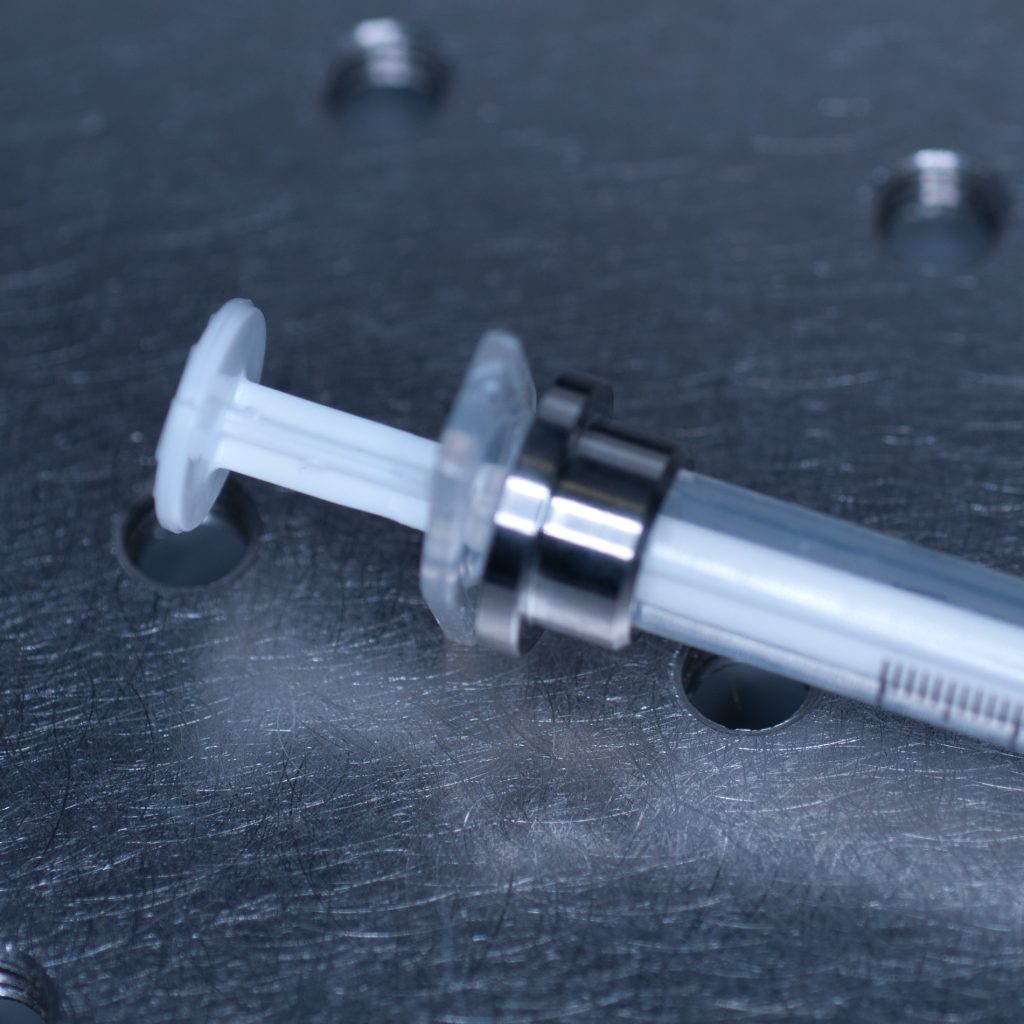
Above: Syringe with the adaptor collar in the correct position.
The flanges themselves also required a trim as they were too long to position underneath the supporting plates of the specimen holder disc. Note to self: we must find another plastic syringe supplier!
Once the syringe had been modified to correctly fit the sample holder it was introduced into the delivery port of the specimen stage, in loading position, by aligning the white markers (see below)
Above: Syringe plus holder inserted into the delivery port of the sample stage (note correct alignment of white markers).
With the front entrance of the lightsheet open and the sample chamber removed, the stage could be safely lowered via the manual stage controller with the safety interlock button depressed (see below).
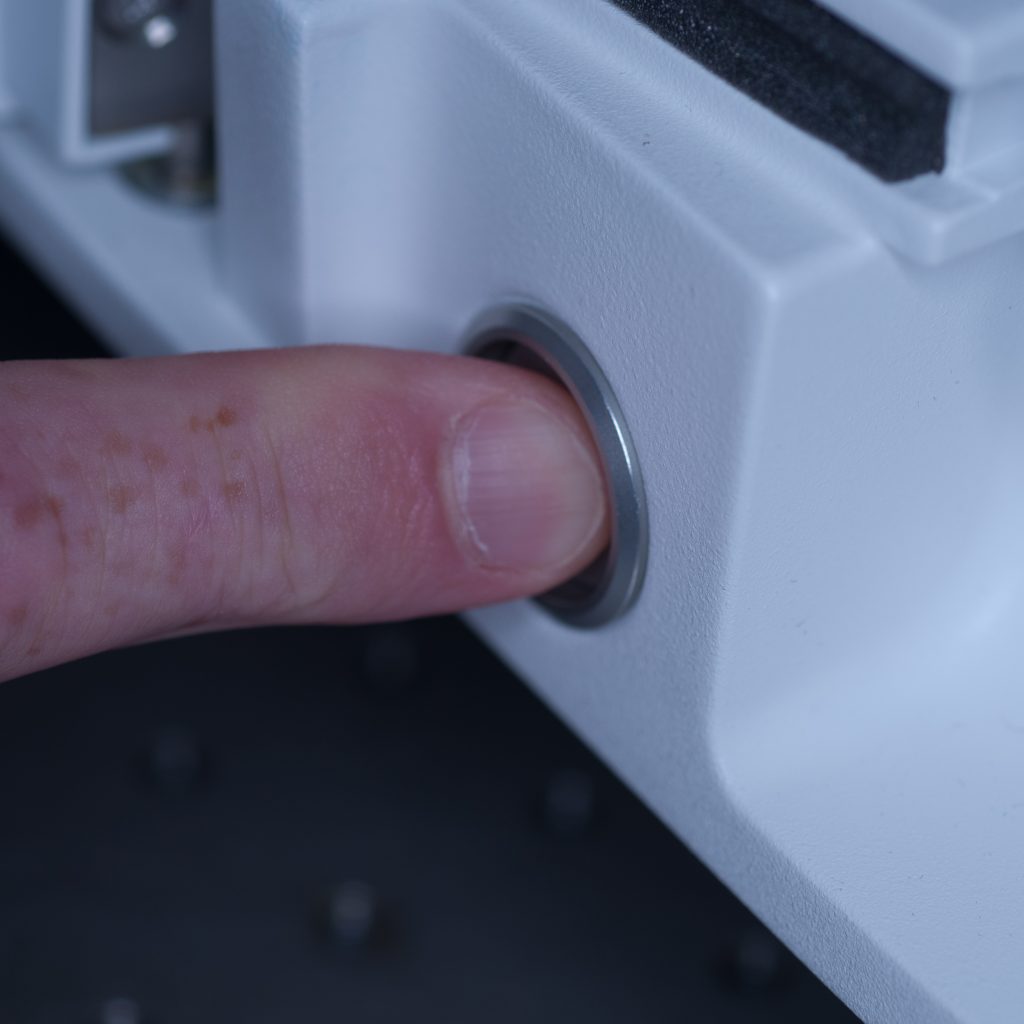 Above: Button for safety interlock under the chamber door.
The stage was lowered so that the syringe tip was accessible from the front entrance of the lightsheet (see below).
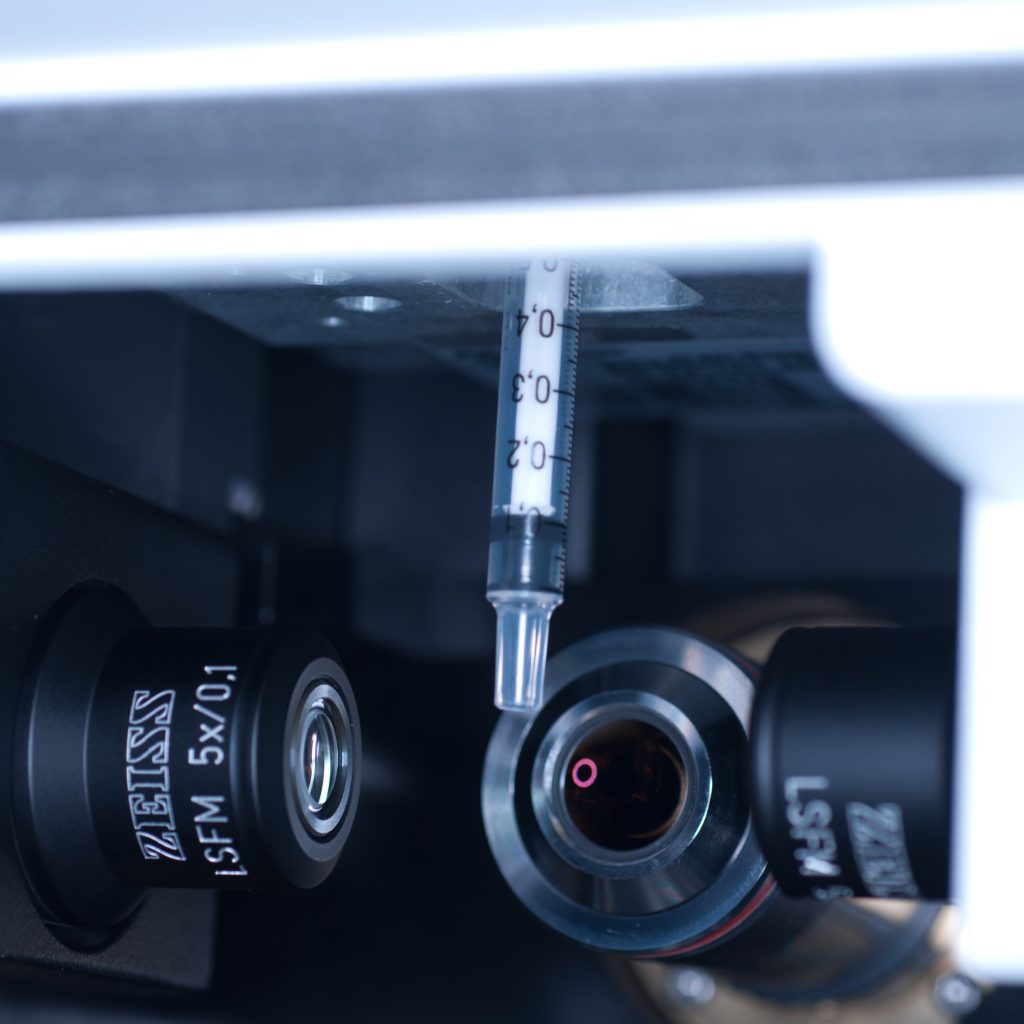
Above: Syringe dropped down to an accessible position.
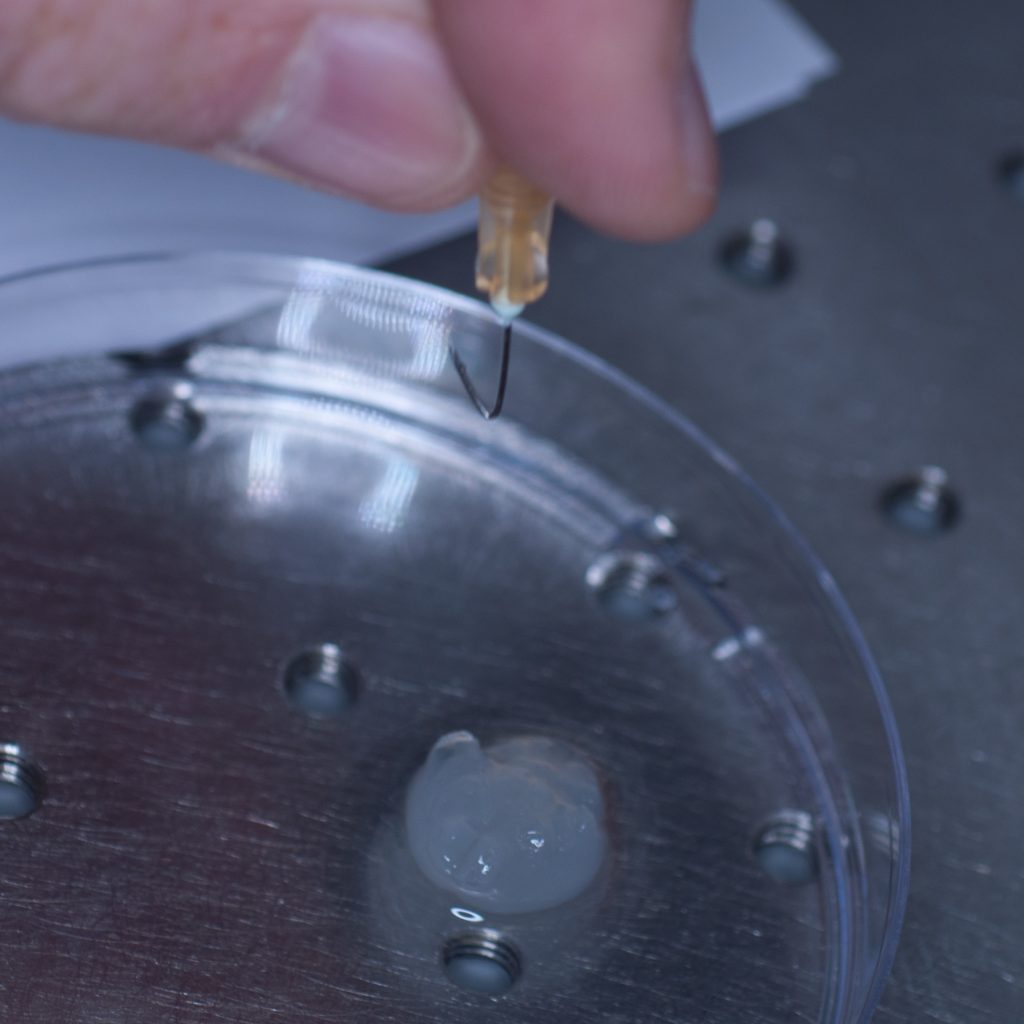
Our first thought was to impale the tissue sample onto a syringe needle so that it could then be attached to the tip of the syringe (see below).
Above: Using a needle to impale the sample.
However, this approach failed miserably as the sample slid off the needle under its own weight. In an attempt to resolve this problem, a hook was fashioned from the needle in the hope that this would support the weight of the tissue (see below).
Above: A pair of pliers was used to bend the needle and make a hook.
Unfortunately, this approach also failed, as the hook tore through the soft tissue like a hot knife through butter.
We decided therefore to chemically bond the tissue to one of the short adaptor stubs included with the lightsheet system with super-glue. The adaptor stubs can be used with the standard sample holder stem designed for capillary insertion. They attach to the base of the stem via an internal locking rod with screw mechanism (shown below).
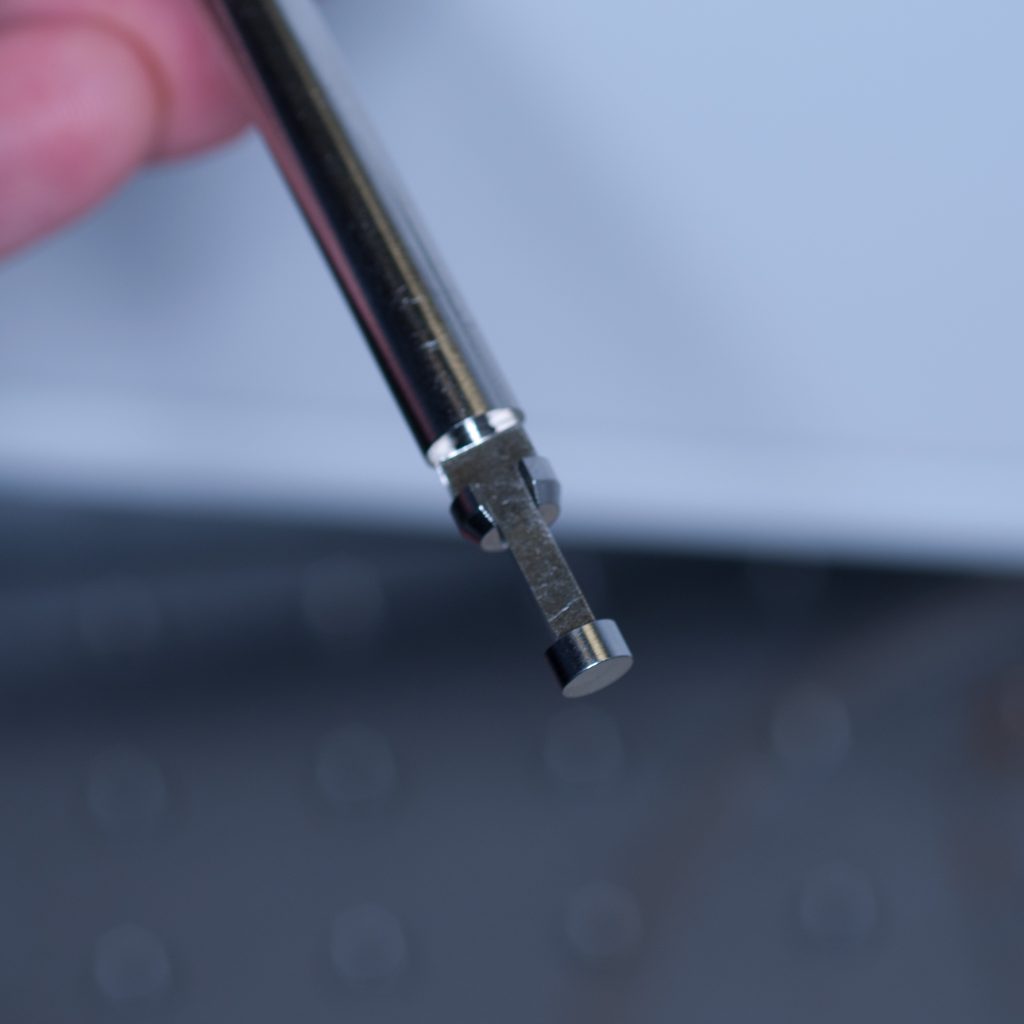
Above: Sample stub for glued samples.
To introduce the sample holder stem into the sample chamber (see below) we used essentially the same process as that described above for the syringe.
 Above: The sample holder stem being lowered into position (the central locking rod can be seen protruding out)
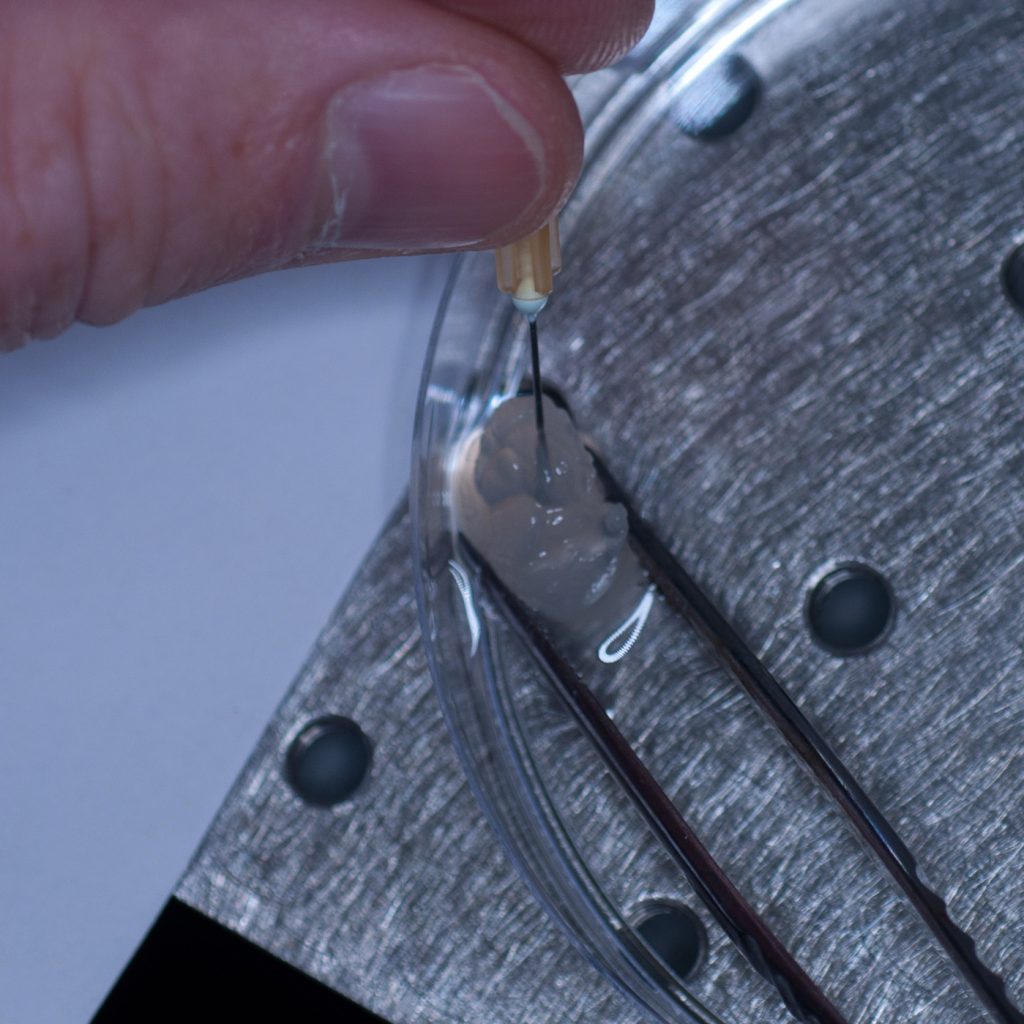
The tissue sample was carefully super-glued on to the adaptor stub for mounting onto the sample holder stem.
Above: Super-gluing the sample on to the adaptor stub.
Again, under its own weight, the sample tore off the stub leaving some adherent surface tissue behind (see below)
Above: Adaptor stub with tissue torn off.
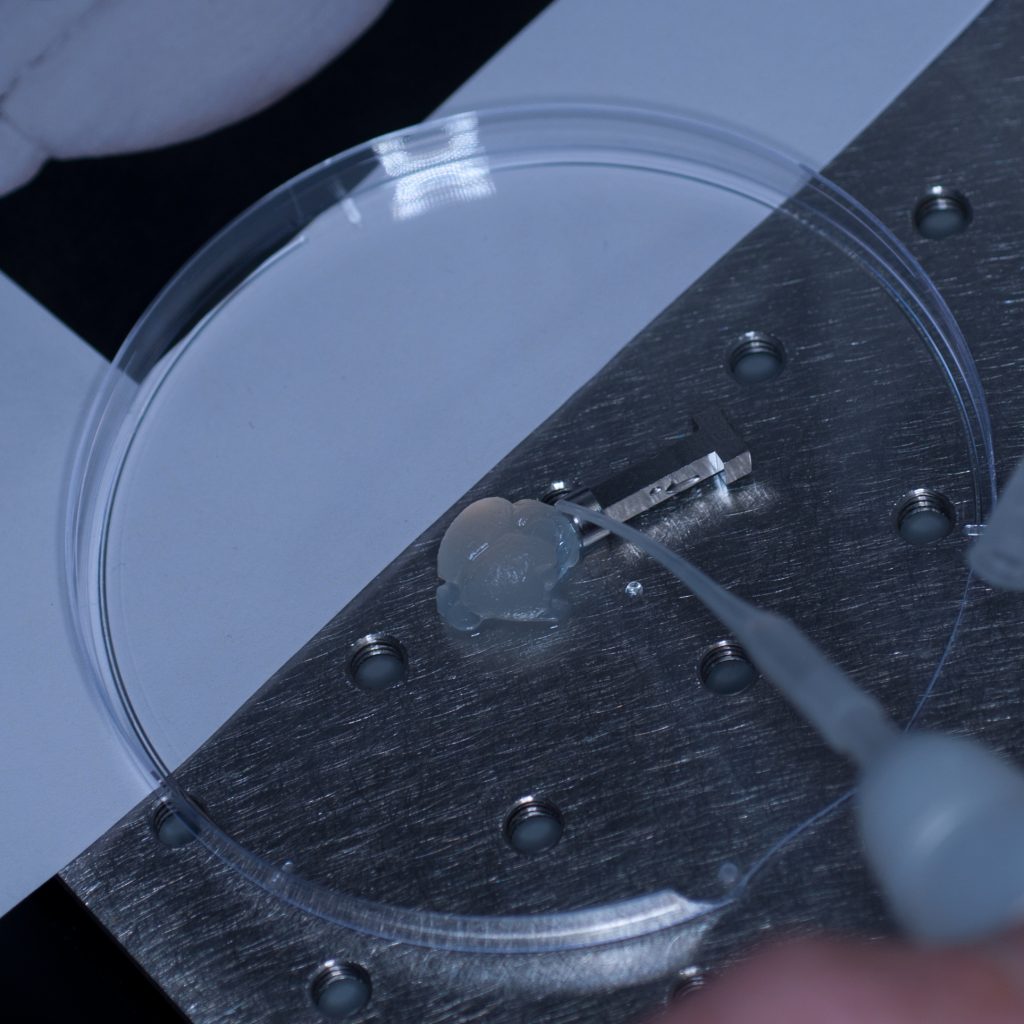
It seemed pertinent at this stage to reduce the sample volume as it was clearly the weight of the tissue that was causing it to detach. Having already visualised the sample under epifluorescence using a stereo zoom microscope we had a very good idea of where the fluorescent signal was localised in the tissue. Consequently, we reduced the sample to approximately one third of its original size and again glued it to the sample stub ensuring that the region of interest would be accessible to the lightsheet (see below).
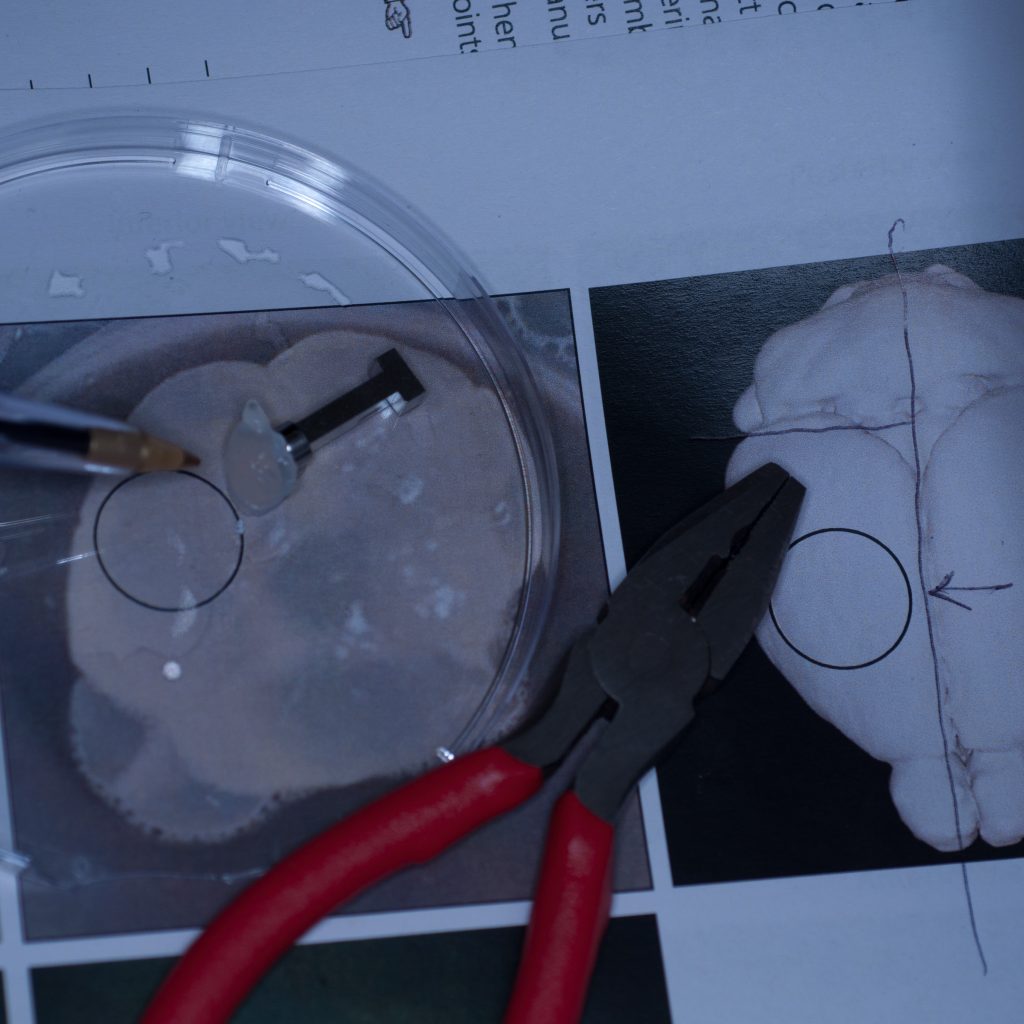
Above: Sample cut down to size and attached successfully to stub.
This time it held. The adaptor stub was then carefully secured to the sample holder stem via its locking rod, the stage manually raised and the sample chamber introduced into the lightsheet. The sample was manually lowered into position so that it was visible through the front viewing portal of the sample chamber. The sample chamber was then carefully filled with distilled water for imaging (remember, we didn’t have any X-CLARITY mounting medium at this stage).
Above: Sample positioned in the imaging chamber.
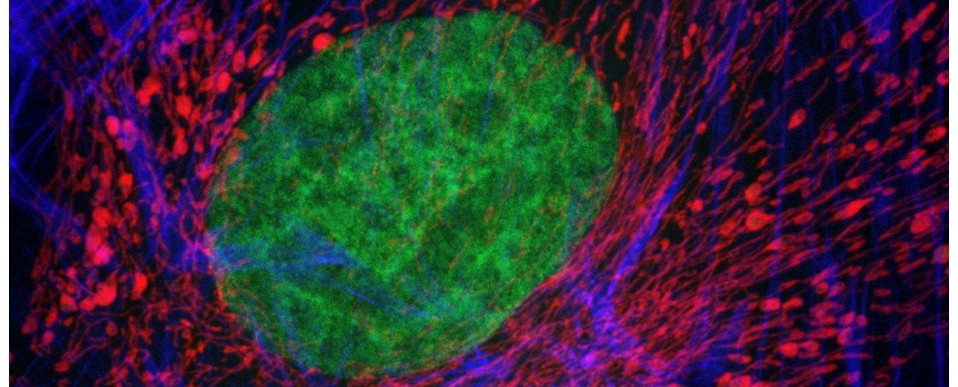
With the sample in place, we then set up the lightsheet for imaging GFP fluorescence. Due to the large sample size, we found that we could only image from one side (the lightsheet couldn’t penetrate the entire sample without being scattered or attenuated). The sample was therefore re-oriented so that the region of interest was presented directly to the lightsheet channel coming in from the right. We then switched on the pivot scan to remove any shadow artefacts and set up a few z-series through the tissue. The image below shows the sort of resolution we was getting off the x5 detection objective using maximum zoom.
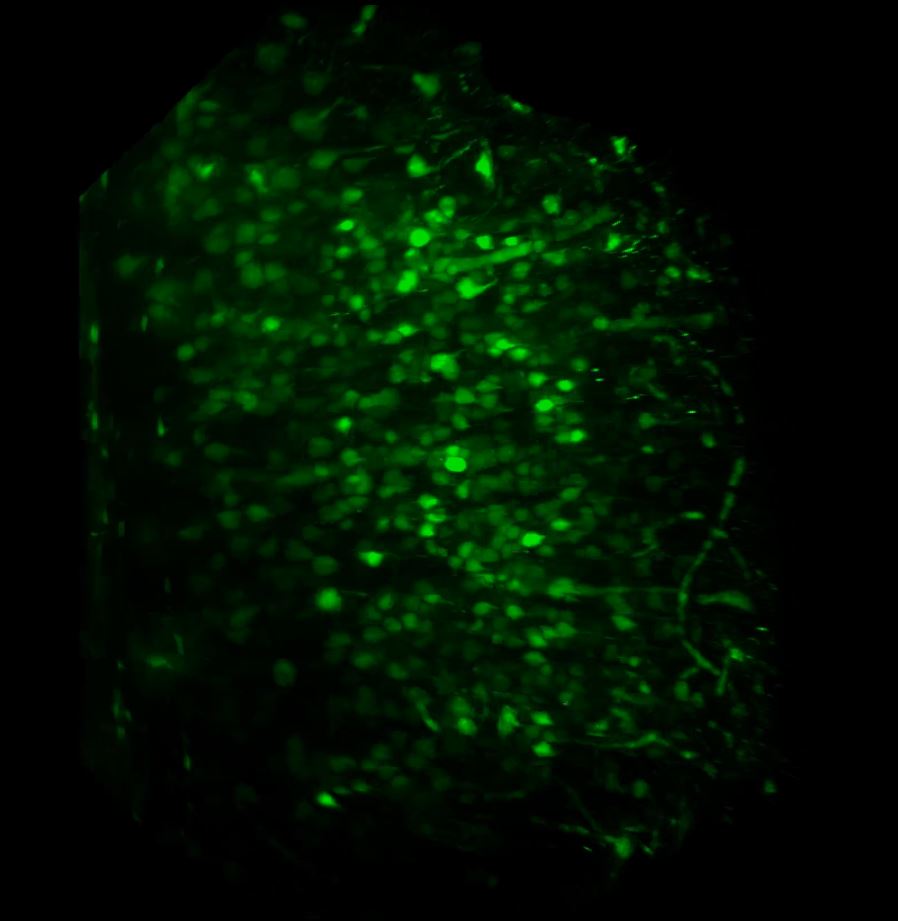 Above: Low power reconstruction of neuronal cell bodies in brain tissue. Dataset taken to a depth of 815 microns from the tissue surface (snapshot of 3D animation sequence).
It took us a fair amount of time to establish a workflow for the correct preparation and presentation of the sample to the lightsheet. However, once we had established this we were able to get some pretty good datasets and in very good time – the actual imaging part was relatively straightforward. The next step will be to repeat the above using the refractive-index matched X-CLARITY mounting medium, try out the x20 clearing objective and utilise the multi-position acquisition feature of the software.
Contributions:
Tissue clearing and labelling, I. M. Garay; preparation, presentation and lightsheet imaging of sample, A. J. Hayes; photography, M. Isaacs; text, M. Isaacs and A.J.Hayes.
Further reading: