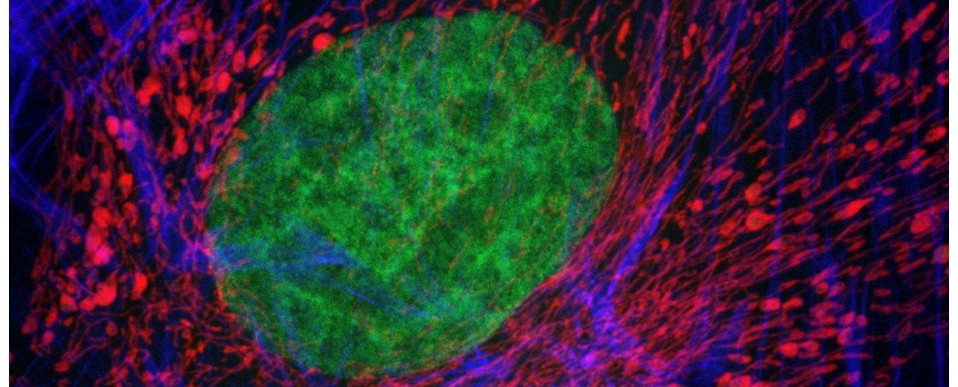
Above: Autofluorescence from mixed connective tissues imaged by confocal microscopy (left). The autofluorescent emissions can be spectrally-resolved through wavelength scanning (right). Excitation at 488nm.
Whilst autofluorescence from endogenous fluorophores can reveal much about the biochemical composition of a sample, it can also hamper the microscopic detection of targeted fluorochromes if they emit light at the same wavelengths as endogenous fluors. Indeed, without proper controls, complex background autofluorescence can lead to misinterpretation of image data and generation of false positive results.
Autofluorescence derives from multiple sources within the sample – the main culprits are NADH and NADPH, lipofuscins, flavins, elastin and collagen (and lignin and chlorophyll in plants). The excitation and emission ranges of the worst offenders have been shown below. It follows that tissues with high collagen and elastin contents, e.g. skin, tendon and cartilage, autofluoresce very brightly; as do tissues that are rich in metabolic breakdown products such as lipofuscin, e.g. liver, spleen etc.

Adding to the problem is the effect of chemical fixatives (e.g. formalin, glutaraldehyde etc) and solvents used to preserve tissue architecture for microscopy: the cross-linkages generated by these chemicals increase autofluorescence, which can be worsened further by long-term storage of the fixed processed tissues.
So, dear reader, here’s some simple advice on steps that you can take to address this common problem:
1. Include an unlabelled control to evaluate the level of autofluorescence within your sample.
- Observation of unlabelled samples through RGB fluorescent filters (note their transmission characteristics) will help identify where in the visible spectrum the autofluorescent signal is brightest.
- Spectral (lambda, wavelength) scanning will allow you to precisely identify the fluorescent emission spectra from endogenous fluorochromes and can help separate their emissions from those of your fluorochrome (see above figure).
2. Select fluorochromes that are outside the range of the autofluorescence.
- If the autofluorescence signal is high in the blue, then move into the green; if it’s high in the green, move into the red – or better still, the far red (if your system can detect in this range).
- Use modern fluorescent probes (e.g. Alexa Fluor, Dylight, or Atto range) instead of first generation fluorochromes. They are brighter, more photo-stable and have narrower excitation and emission bands. They are also available in variants that span the near UV, visible and far red range of the spectrum, affording you plenty of choice.
3. Use a microscope with filters optimised for your choice of fluorochromes.
- Band-pass filters which collect emissions within a specific range may be more useful than long-pass filter sets which collect all emissions past a certain wavelength. The narrower the range of the band-pass filter, then the better it can separate fluorophores with close emission spectra.
4. If the autofluorescence is unevenly distributed within your sample, use targeted microscopy to avoid it.
5. If you can’t avoid the autofluorescence, then take measures to remove or reduce it.
- Analyse the pixel intensity distribution within your image and try thresholding out the lower intensity autofluorescence signal.
- Pre-bleach your samples in a light box using a high intensity illumination source prior to fluorescent labelling (see below reference)
- Treat samples with a chemical reagent (e.g. sodium borohydride, Sudan black B, ammonium ethanol etc) to reduce background autofluorescence (see below reference)
6. If all else fails, consider the following:
- use cryoprocessed material as an alternative to chemical fixation and paraffin wax processing.
- avoid long term storage of material/archival tissue samples.
- try a different detection modality (e.g. immunoperoxidase instead of immunofluorescence)
AJH
Further reading
Wright Cell Imaging Facility. Autofluorescence: Causes and Cures
