Introduction
In an age of routine immunofluorescence, FISH, RNAScope and automated massively-multiplexed imaging there’s still a place in microscopy for traditional histological techniques. Almost every tissue sample that is processsed for an advanced technique will have an accompanying slide stained with haematoxylin and eosin (H&E) and several other methods remain useful – such as toluidine blue, periodic acid-Schiff, Perls’ prussian blue, alcian blue and Masson’s trichrome. Of these, Masson’s trichrome is probably the most widely used, particularly in research.
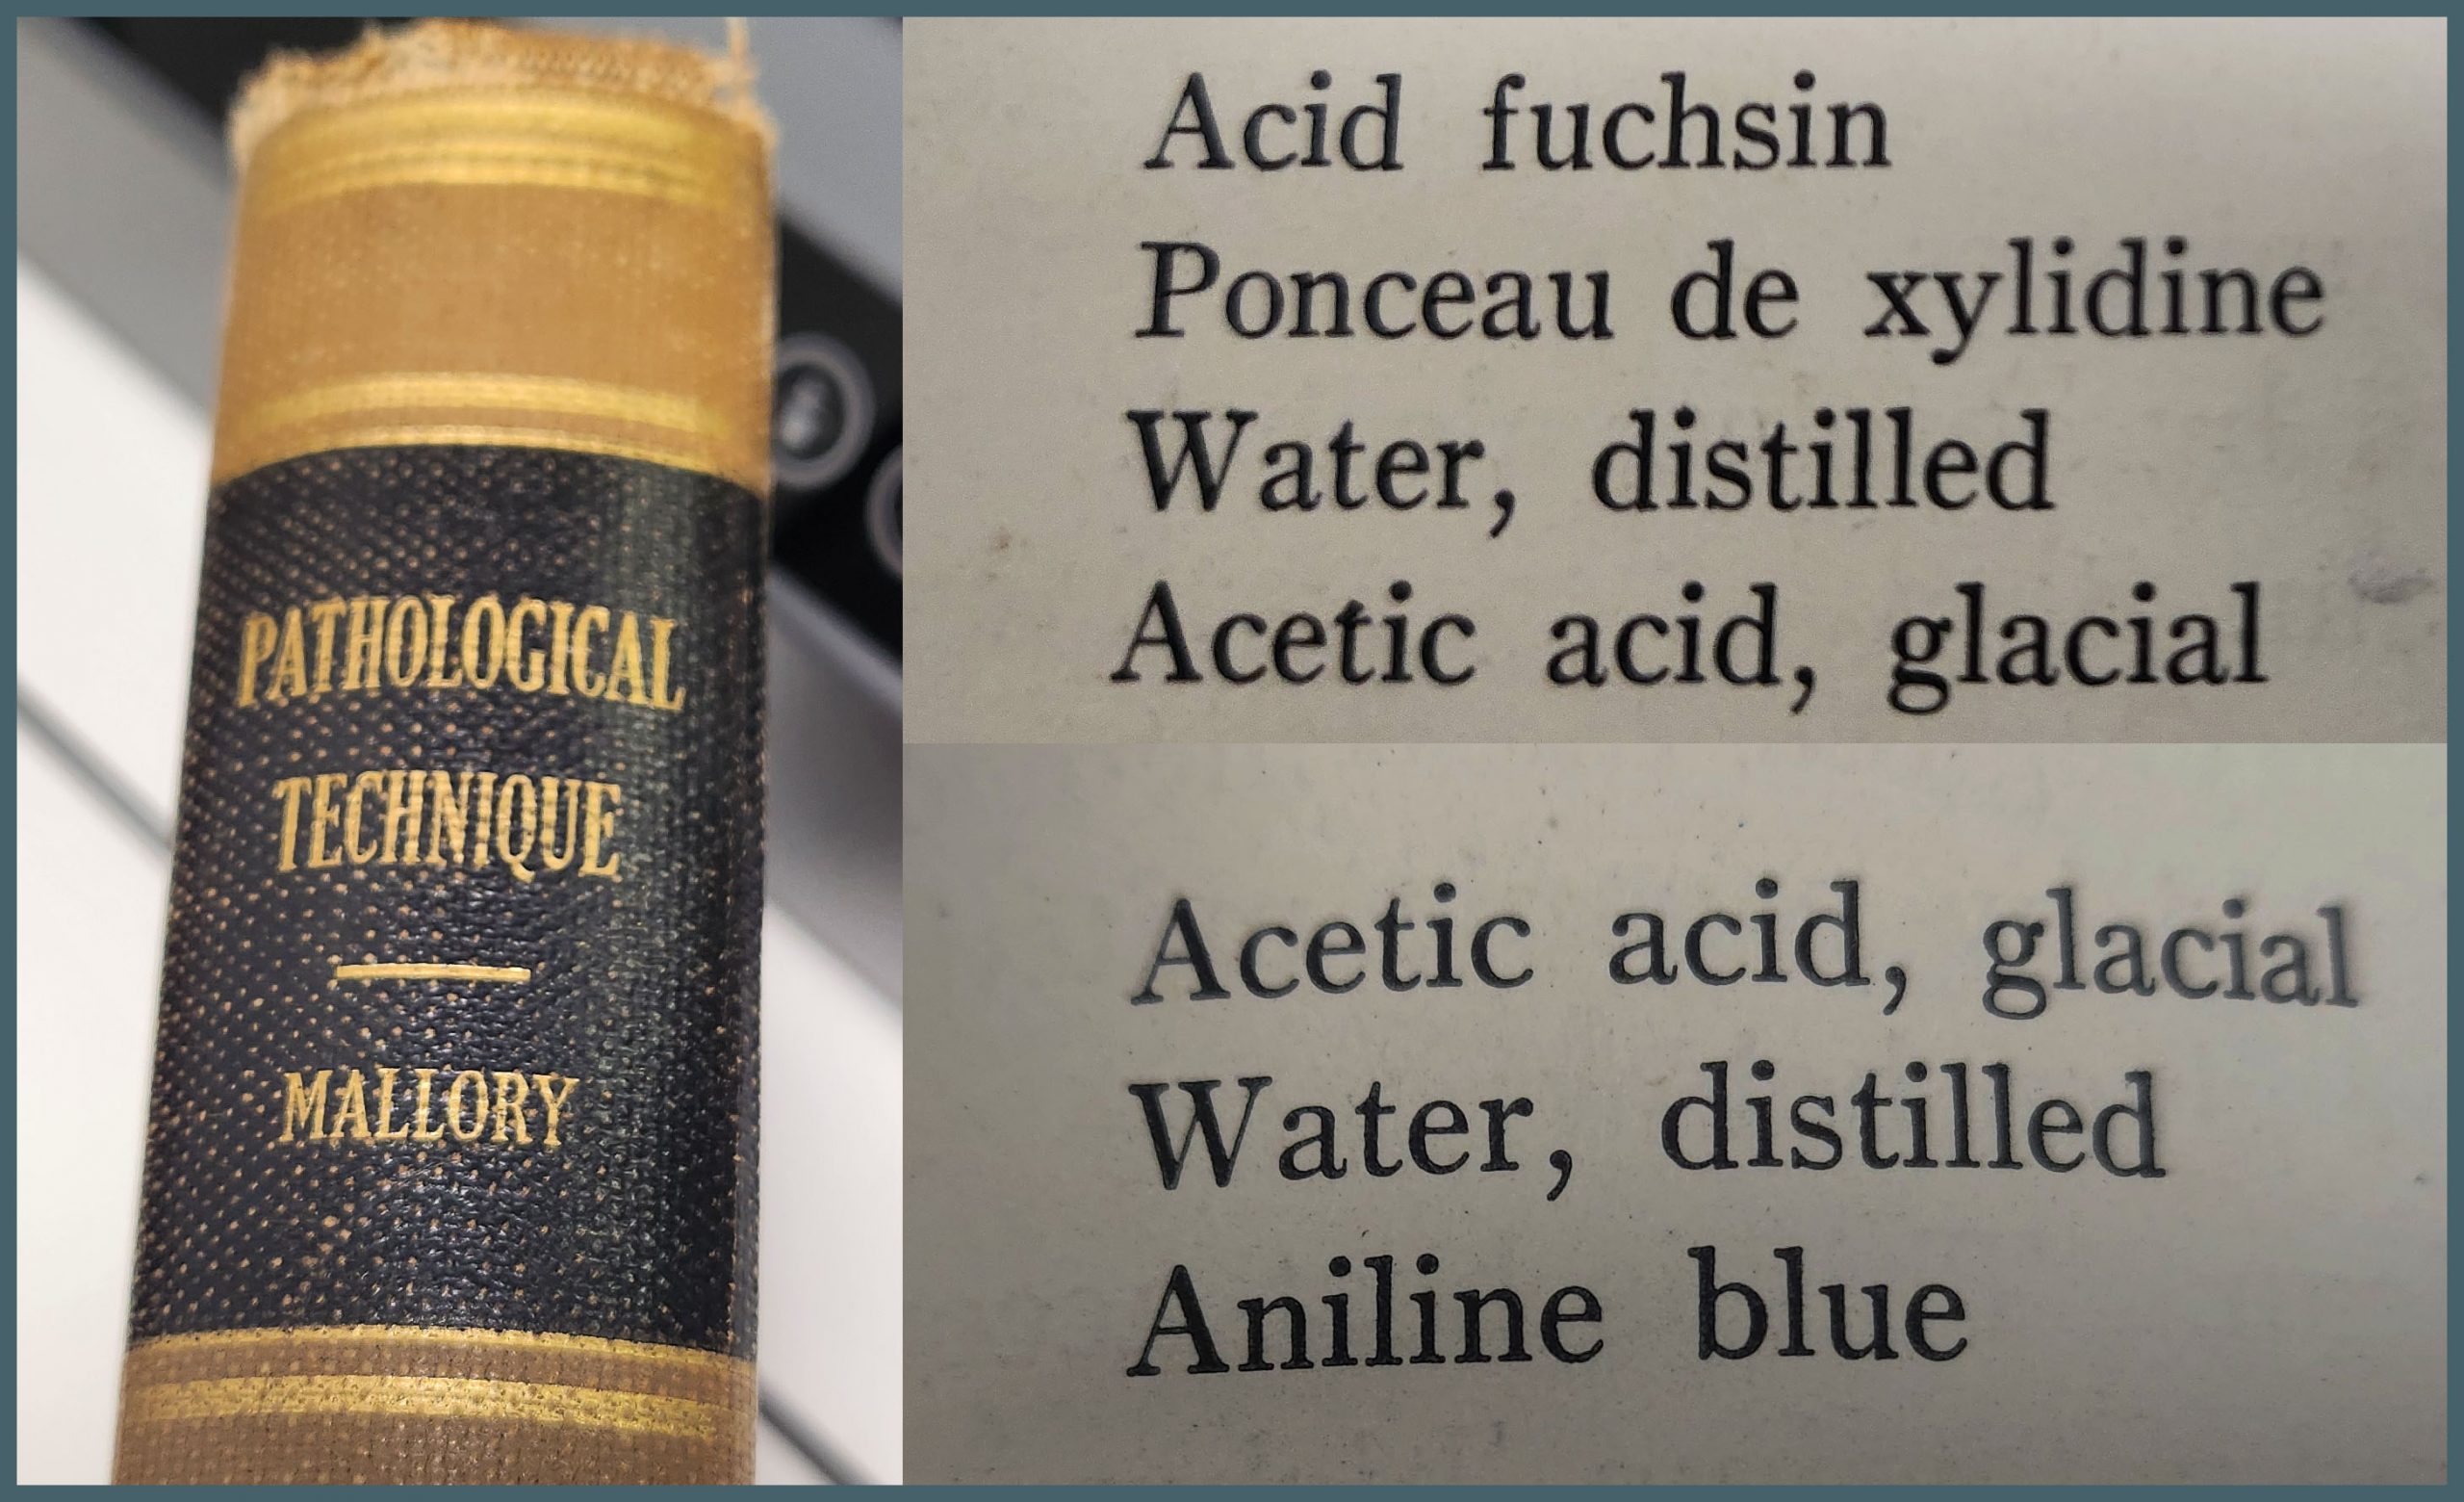
Masson’s trichrome consists of three components – a nuclear stain, a stain that’s specific to collagen (the fibre stain) and a third stain that provides overall tissue context (the plasma stain). It’s remarkably difficult to find a definitive reference online to the exact stains that Masson used for his original trichrome. The oldest textbook I have access to is Pathological Technique by Mallory (1938). This lists the stains used as aniline blue for the fibre stain and a mixture of acid fuchsin and ponceau de xylidine for the plasma stain. This latter stain is presumably what is now referred to as ponceau fuchsin. As Mallory was a contemporary of Masson it’s reasonable to assume that this represents the original method.
The protocol described by Mallory is close to what many people would use today. However, many alternative variants are in general use. A common variation uses light green instead of aniline blue as described in Theory and Practice of Histological Technique, Bancroft and Stevens (latterly Bancroft and Gamble). Other methods use biebrich scarlet acid fuchsin rather than ponceau fuchsin, methyl blue instead of aniline blue – and there are others.
Difficulty arises from the fact that very few papers report exactly what Masson’s trichrome they have used. They usually say they used a ‘standard protocol’ or they include a reference to a method in a previous paper that invariably doesn’t contain a protocol either. This makes it impossible to directly reproduce.
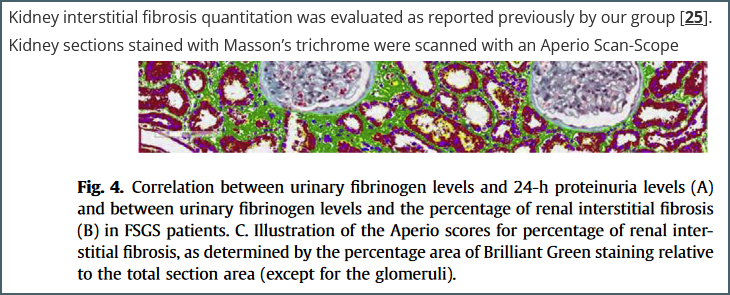
An example reference. The figure is from reference [25] but the paper contains few details about the protocol used other than the fact that it uses ‘Brilliant Green’ – a stain I hadn’t even heard of until starting this writeup.
This is not satisfactory so as part of some ongoing work I decided to look at methods from various sources and trial them on several tissue types. I came up with a rough average based on many different protocols. There were two common plasma stains and three common fibre stains. This gave six base protocols, details of which at the end of this post.
- Biebrich scarlet acid fuchsin (BSAF) and aniline blue (AB)
- BSAF and methyl blue (MB)
- BSAF and light green (LG)
- Ponceau fuchsin (PF) and AB
- PF and MB
- PF and LG
I decided to omit the usual haematoxylin counterstain and just focus on the components that are more specific to Masson’s trichrome – the plasma and fibre stains.
Bouin’s solution
The original Masson’s method used Bouin’s solution (called Bouin’s fluid by Mallory) – a fixative containing formaldehyde, picric acid and acetic acid. This is generally believed to enhance trichrome staining. This isn’t routinely used in modern labs but the same benefit can be gained by soaking slides in Bouin’s solution after dewaxing and rehydration.
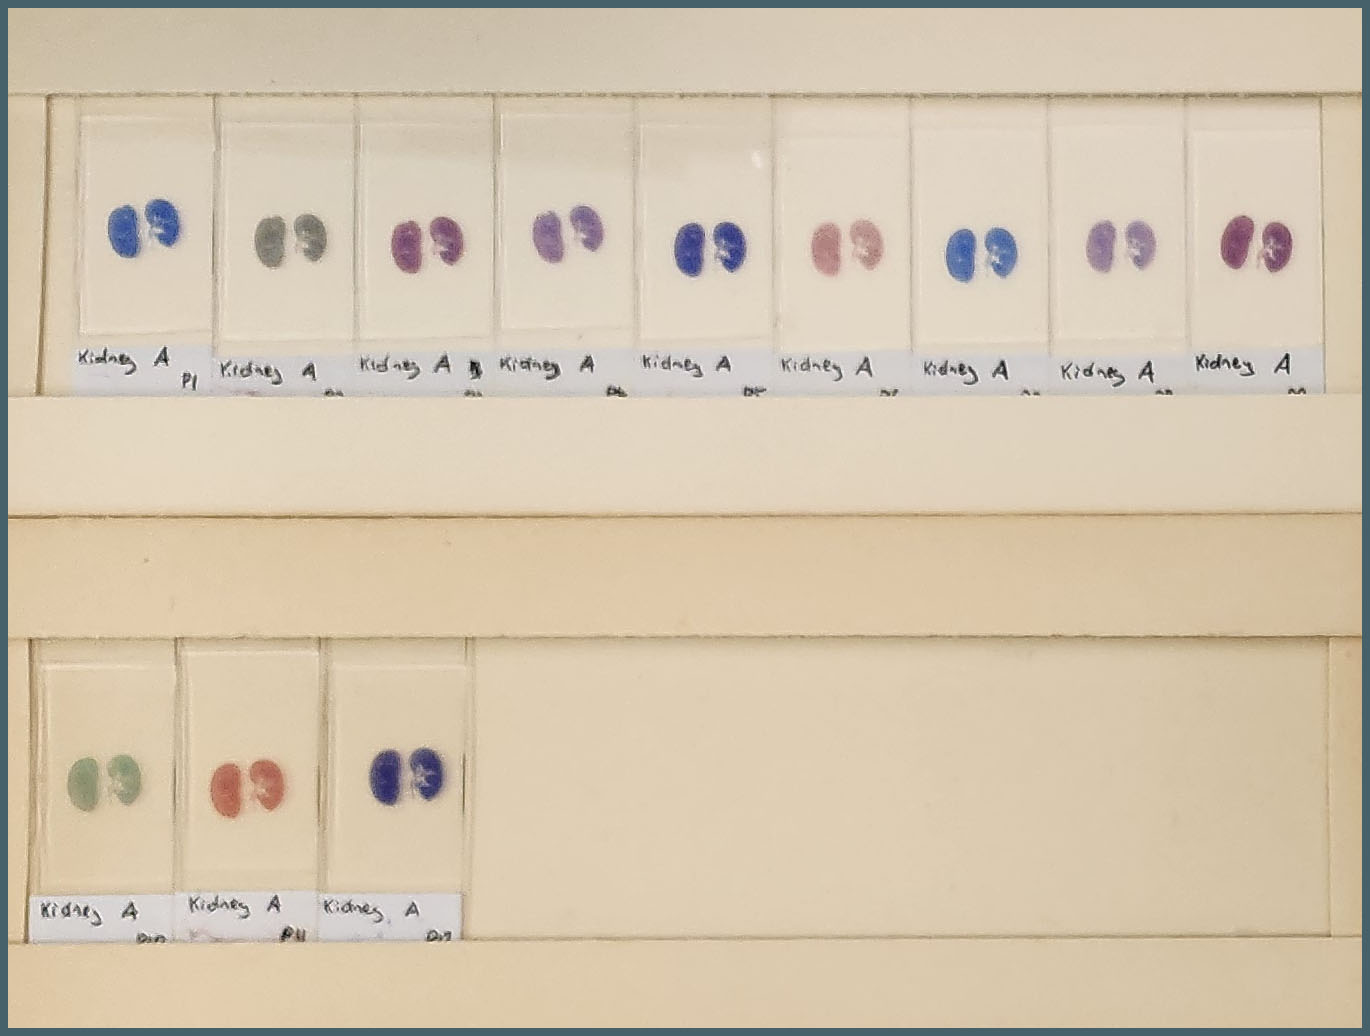
To test the effect of Bouin’s solution I ran two sets of my six protocols – one set with a Bouin’s soak, one without. This gave me a total of twelve protocols to examine.
The tissues used were formalin-fixed mouse tissues. Normal kidney, fibrotic kidney, lung, pancreas and spleen. A set of twelve slides were produced from each tissue with one assigned to each protocol. It was immediately obvious there was a huge amount of variation between the protocols.
To compare microscopically, roughly the same region from each slide was photographed at 4x and 20x magnification and plates assembled. These will all be available to download at the end of this post but here I’ll focus on notable points.
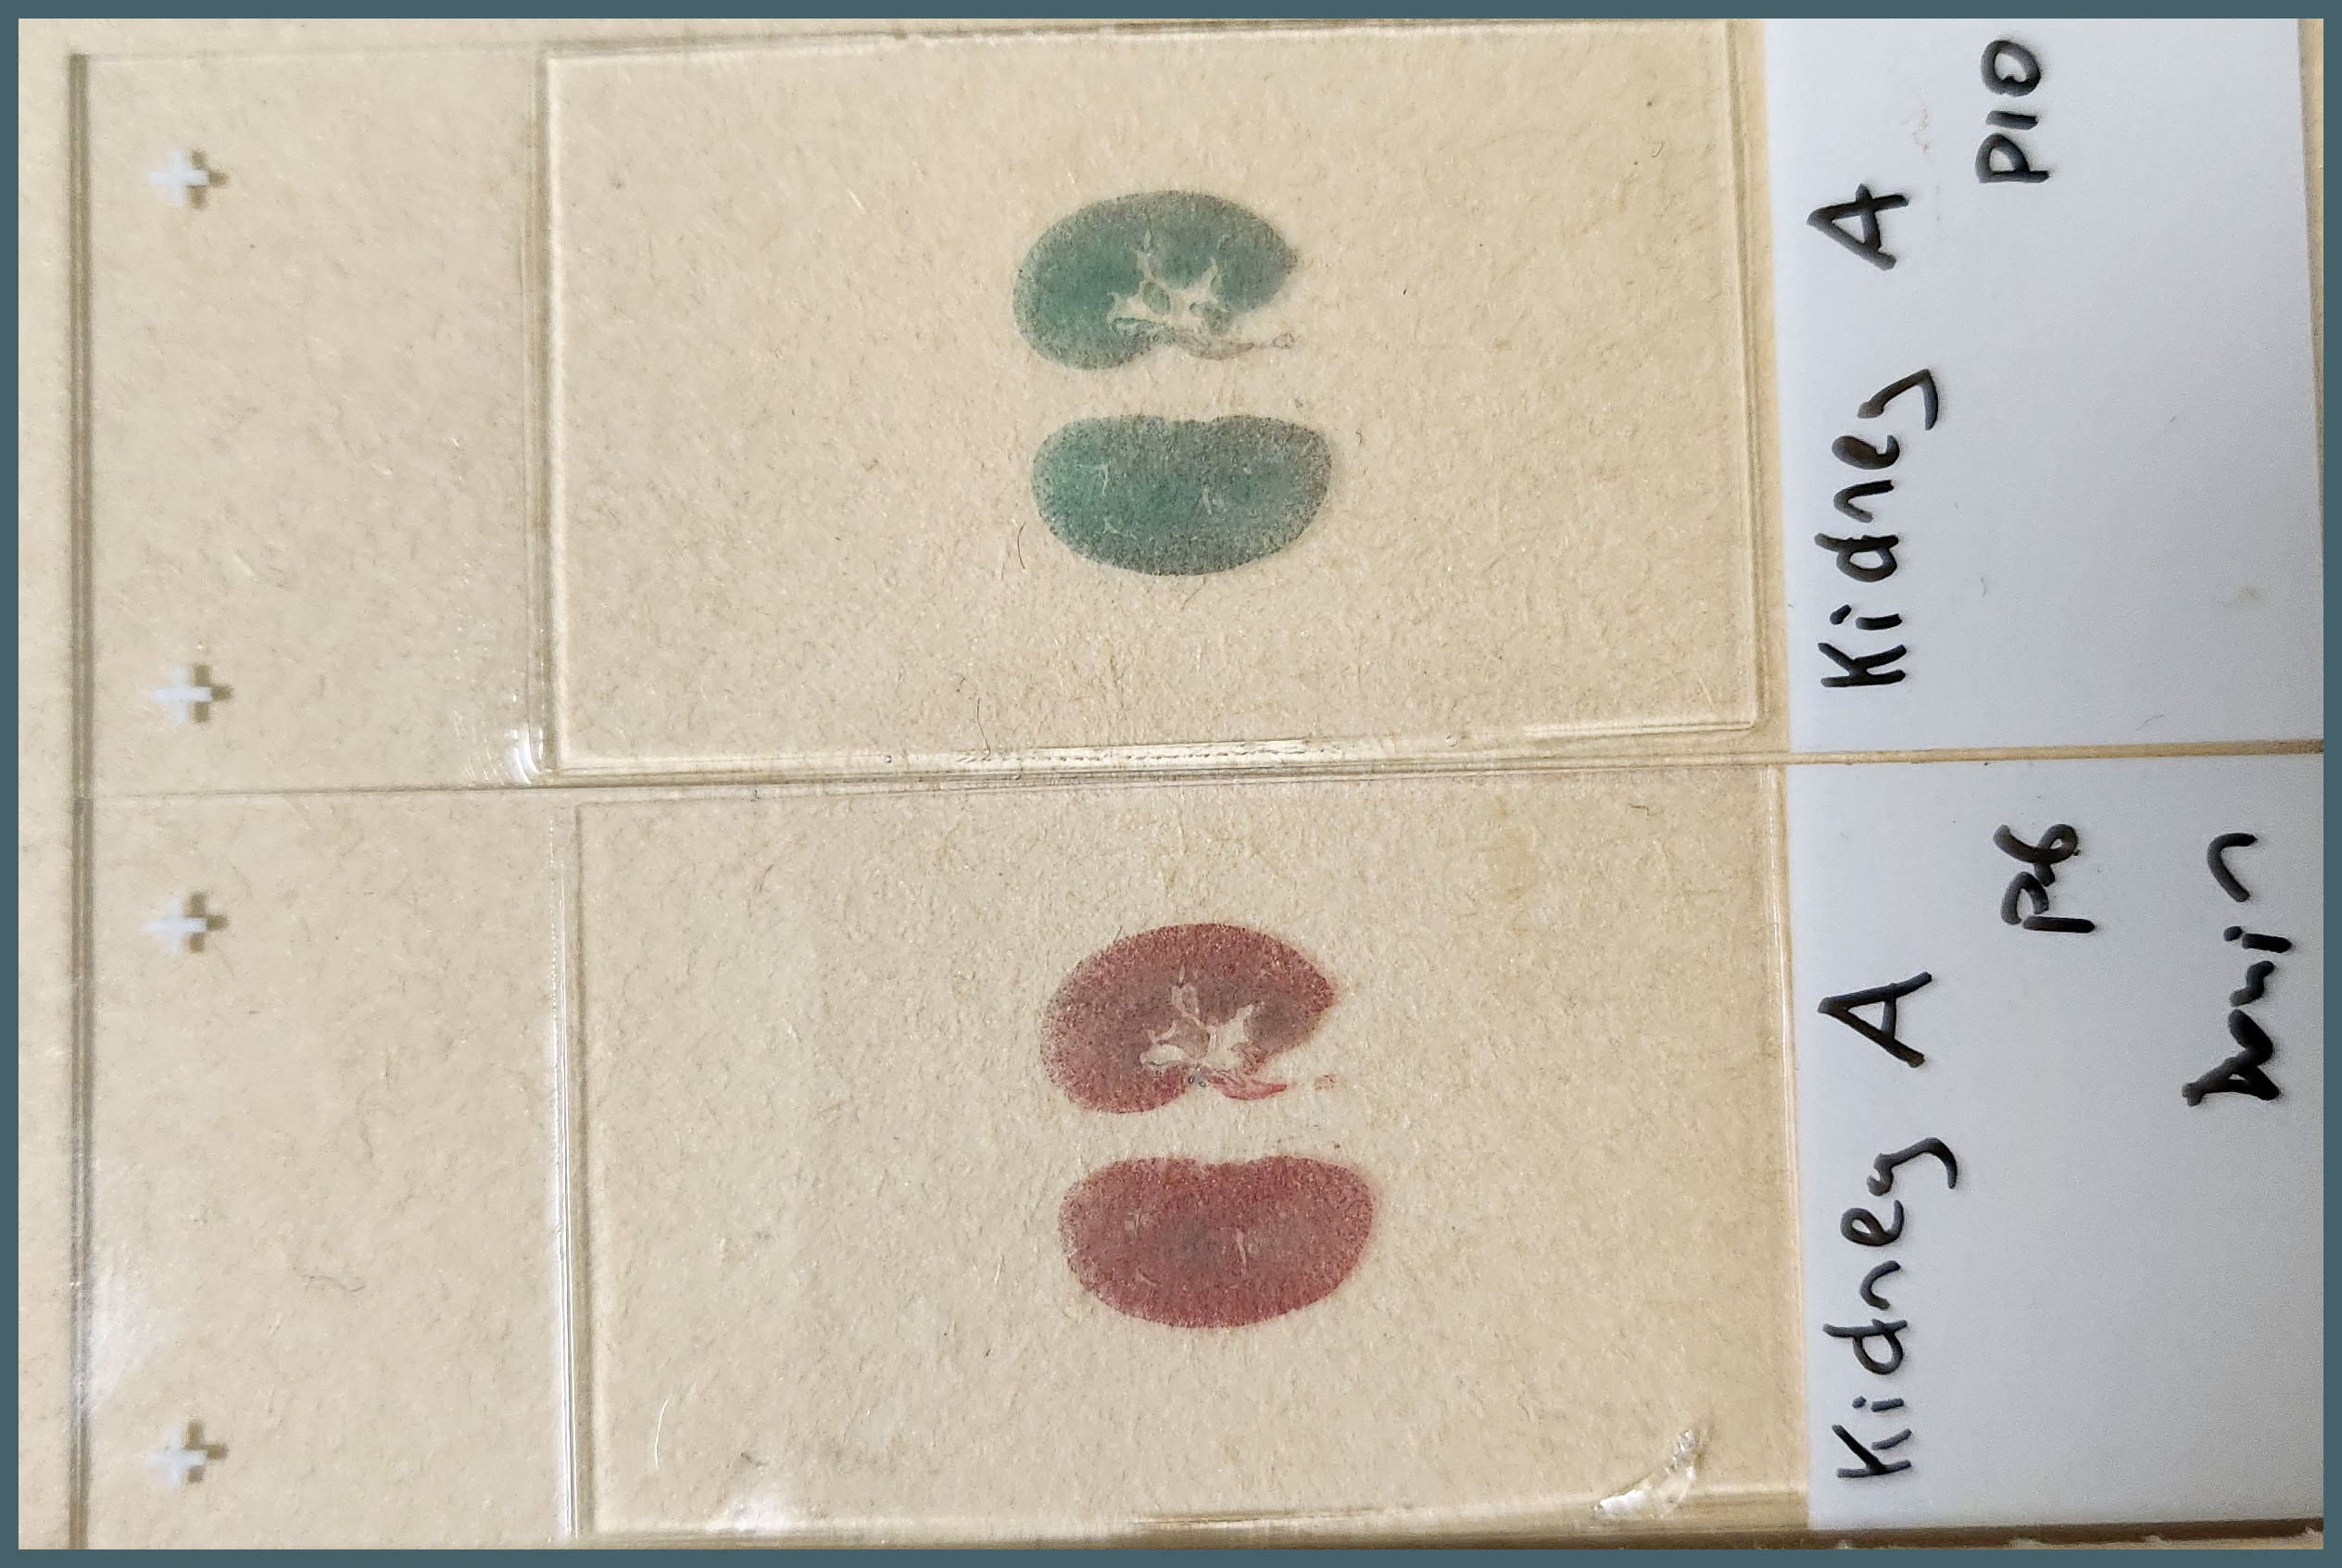
The first thing that stood out was the effect that Bouin’s solution had, even to the naked eye.
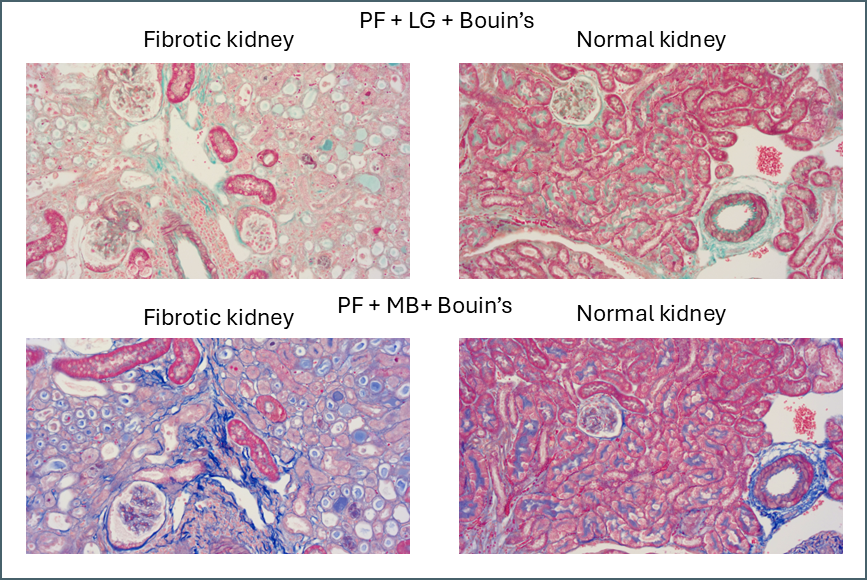
Microscopically you can see that the plasma stain (PF) is almost completely lost.
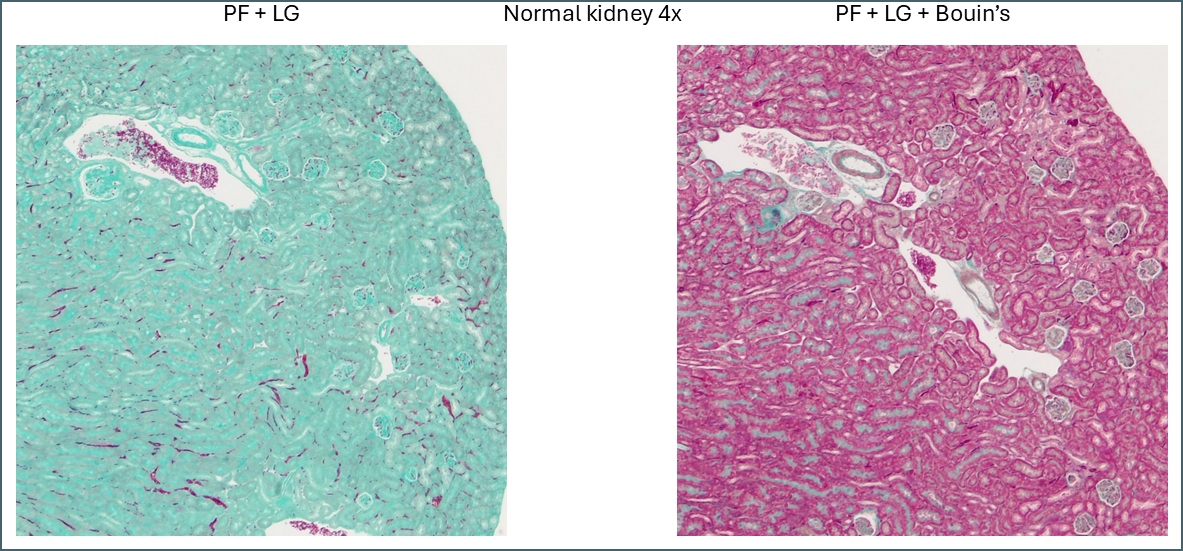
WIthout Bouin’s the fibre stain (light green) stains practically the entire kidney section. Only red blood cells retain the plasma stain.
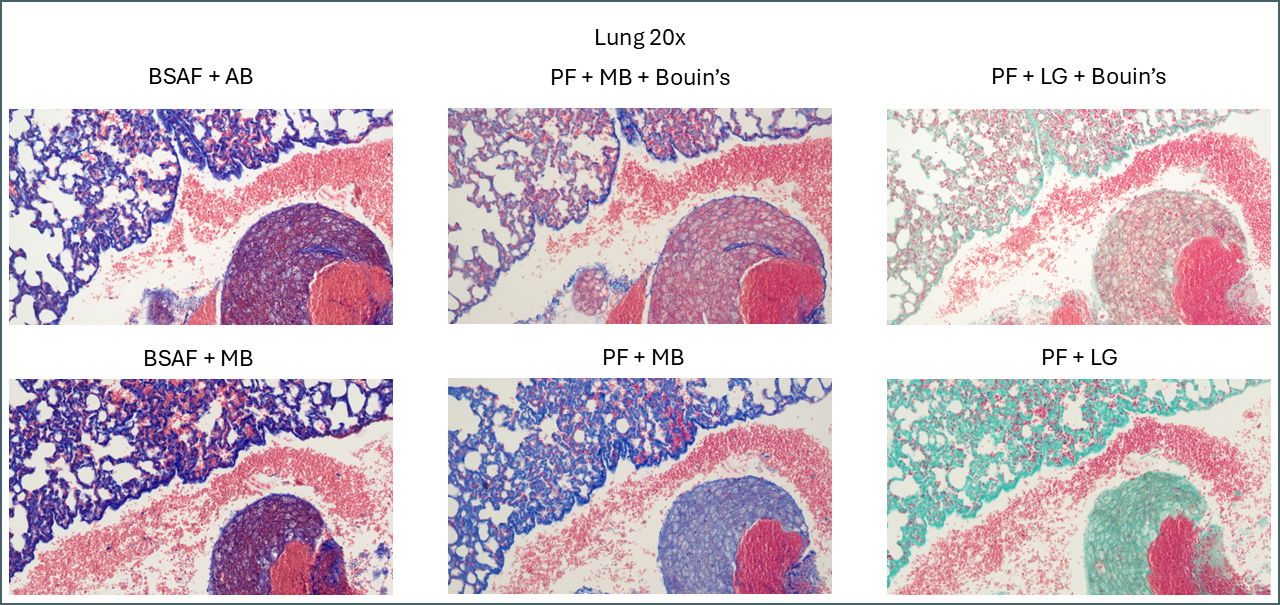
Bouin’s has a similar effect in some of the other tissues but not to quite as dramatic an extent. In lung, for example, the effect is relatively subtle.
Broadly speaking, it appears that Bouin’s causes more plasma stain to be retained. This reduces the intensity of the fibre staining, presumably by blocking sites that the fibre stain would otherwise bind to. You can also see some differences between the different plasma stains and the different fibre stains. In summary, there’s not that much to note on lung tissue. You could probably use any of these protocols interchangeably.
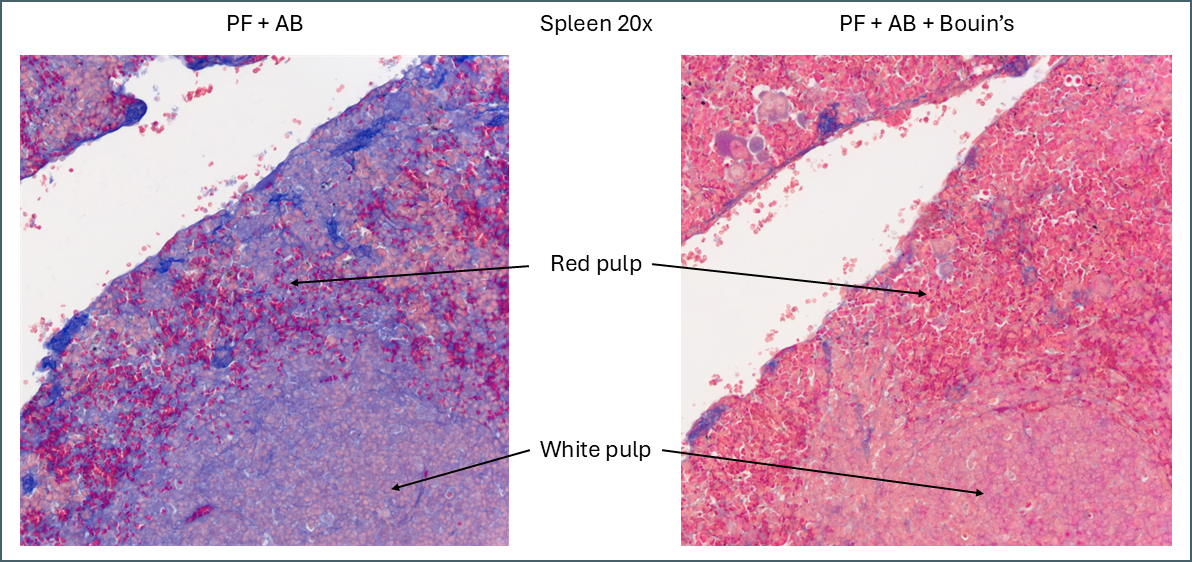
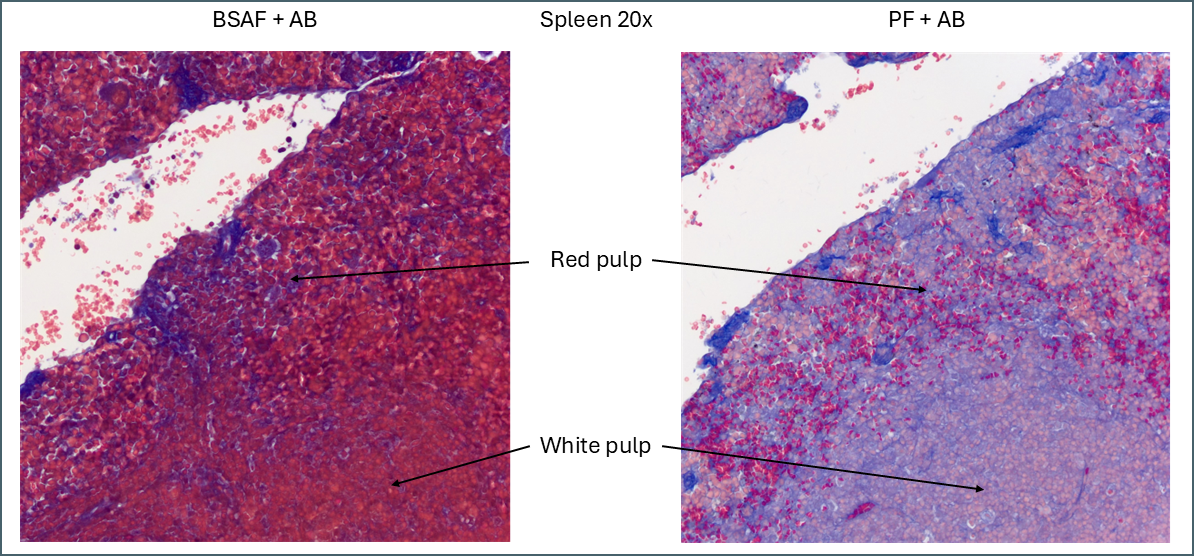
While Bouin’s seems to give a more classic staining pattern, on spleen tissue it may be more beneficial to avoid using it.
Bouin’s has a similar effect to other tissues in that it causes more of the plasma stain to be retained. In this instance this makes the distinction between the red pulp and the white pulp far less apparent. The specific collagen staining is also less obvious as it’s partially masked by the plasma staining. By eye, the collagen staining stands out clearly against the background when Bouin’s isn’t used but image analysis software might have an easier job with the Bouin’s tissue.
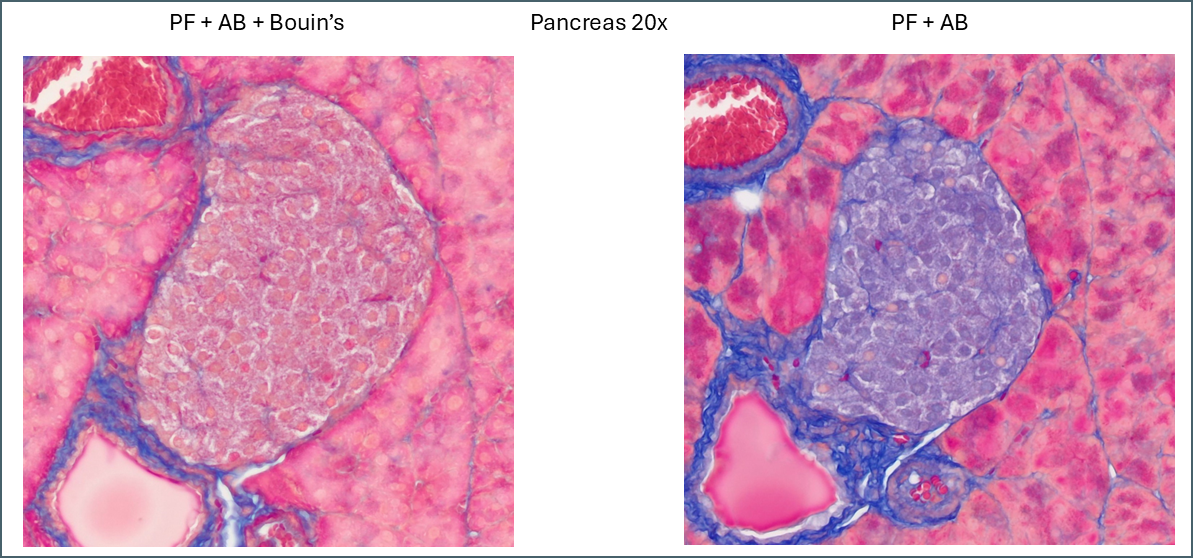
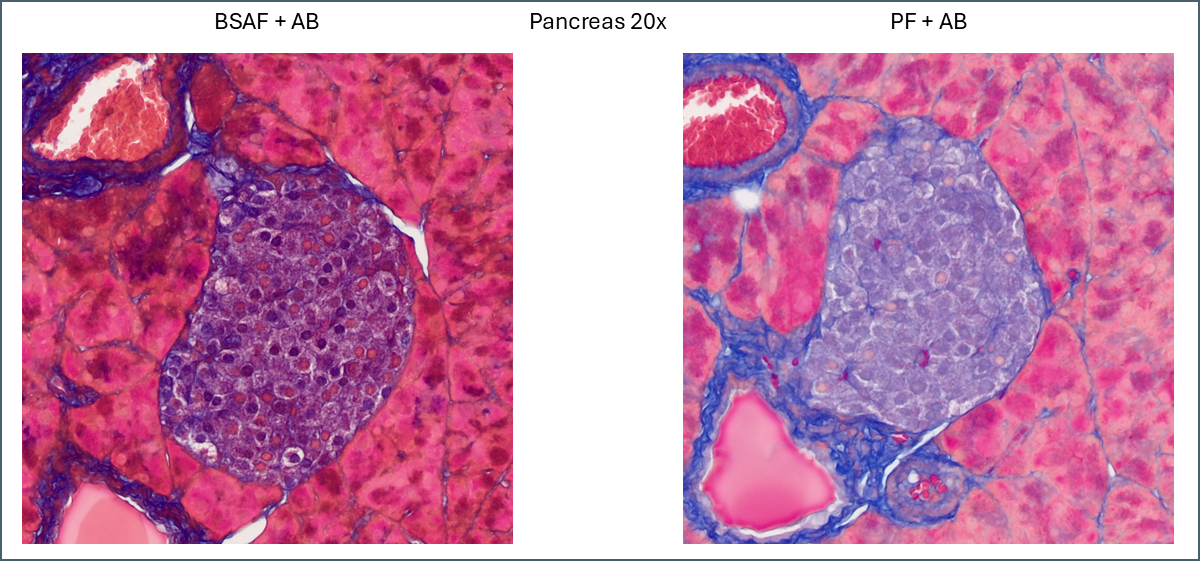
Similarly, a lot of tissue differentiation is lost in pancreas tissue.
When Bouin’s is omitted, the islets of Langerhans retain almost none of the plasma stain which causes them to show up very clearly with whatever fibre stain is used. It’s at a fairly low level so can still be differentiated from the collagen staining around the duct and blood vessel. Also of note is a subpopulation of cells which appear with pink nuclei. From the proportion of the cells it’s possible that these are delta cells but there’s no way to be sure from this image alone.
That just about covers the effects that Bouin’s solution has. Most sources will recommend Bouin’s for trichrome stains but I think it’s clear from the above that it depends what you’re aiming to achieve. It means that far more plasma stain is retained but this isn’t necessarily ideal for all purposes.
Fibre stains
Now we’ll look at the different fibre stains used – aniline blue, methyl blue and light green.
There’s very little difference between aniline blue and methyl blue across all tissue types. After running the protocols I discovered that aniline blue contains methyl blue anyway so they’re chemically very similar. The recipes used contain different concentrations of acetic acid, however, so there is still some value to the comparison. Personally I think that the light green is more visually striking than the blues. For computer segmentation though I think the blues would be superior. From the RGB values they are quite close to being pure blue while the ‘green’ is in fact almost perfectly blue-green. This would be more difficult to process for automatic segmenting.
Plasma stains
The plasma stains used were biebrich scarlet acid fuchsin (BSAF) and ponceau fuchsin (PF). On the whole they stained quite similarly. BSAF was a bit darker and muddier while PF was brighter and clearer. Some of these differences could potentially be altered by varying the protocols as there were some key variations – most notably the time in phosphomolybdic acid. In spleen and pancreas there was a meaningful difference in the staining pattern.
Even without Bouin’s a large amount of BSAF is retained in the spleen compared to the PF. As this stain is very widely distributed it makes it much more difficult to define the area of red pulp vs white. In this instance ponceau fuchsin is preferable.
For pancreas tissue it’s more difficult to say that one plasma stain is better than the other.
PF is still brighter and clearer while BSAF is darker and muddier. Overall differentiation of the islet is far clearer with PF. As mentioned earlier the PF is showing a pink subpopulation of cells, possibly delta cells. Conversely, BSAF shows two subpopulations of cells which are far more numerous than the pink cells – some are red/pink while the others are dark purple. From the proportions its difficult to guess at what these cells might be but it’s certainly a notable difference.
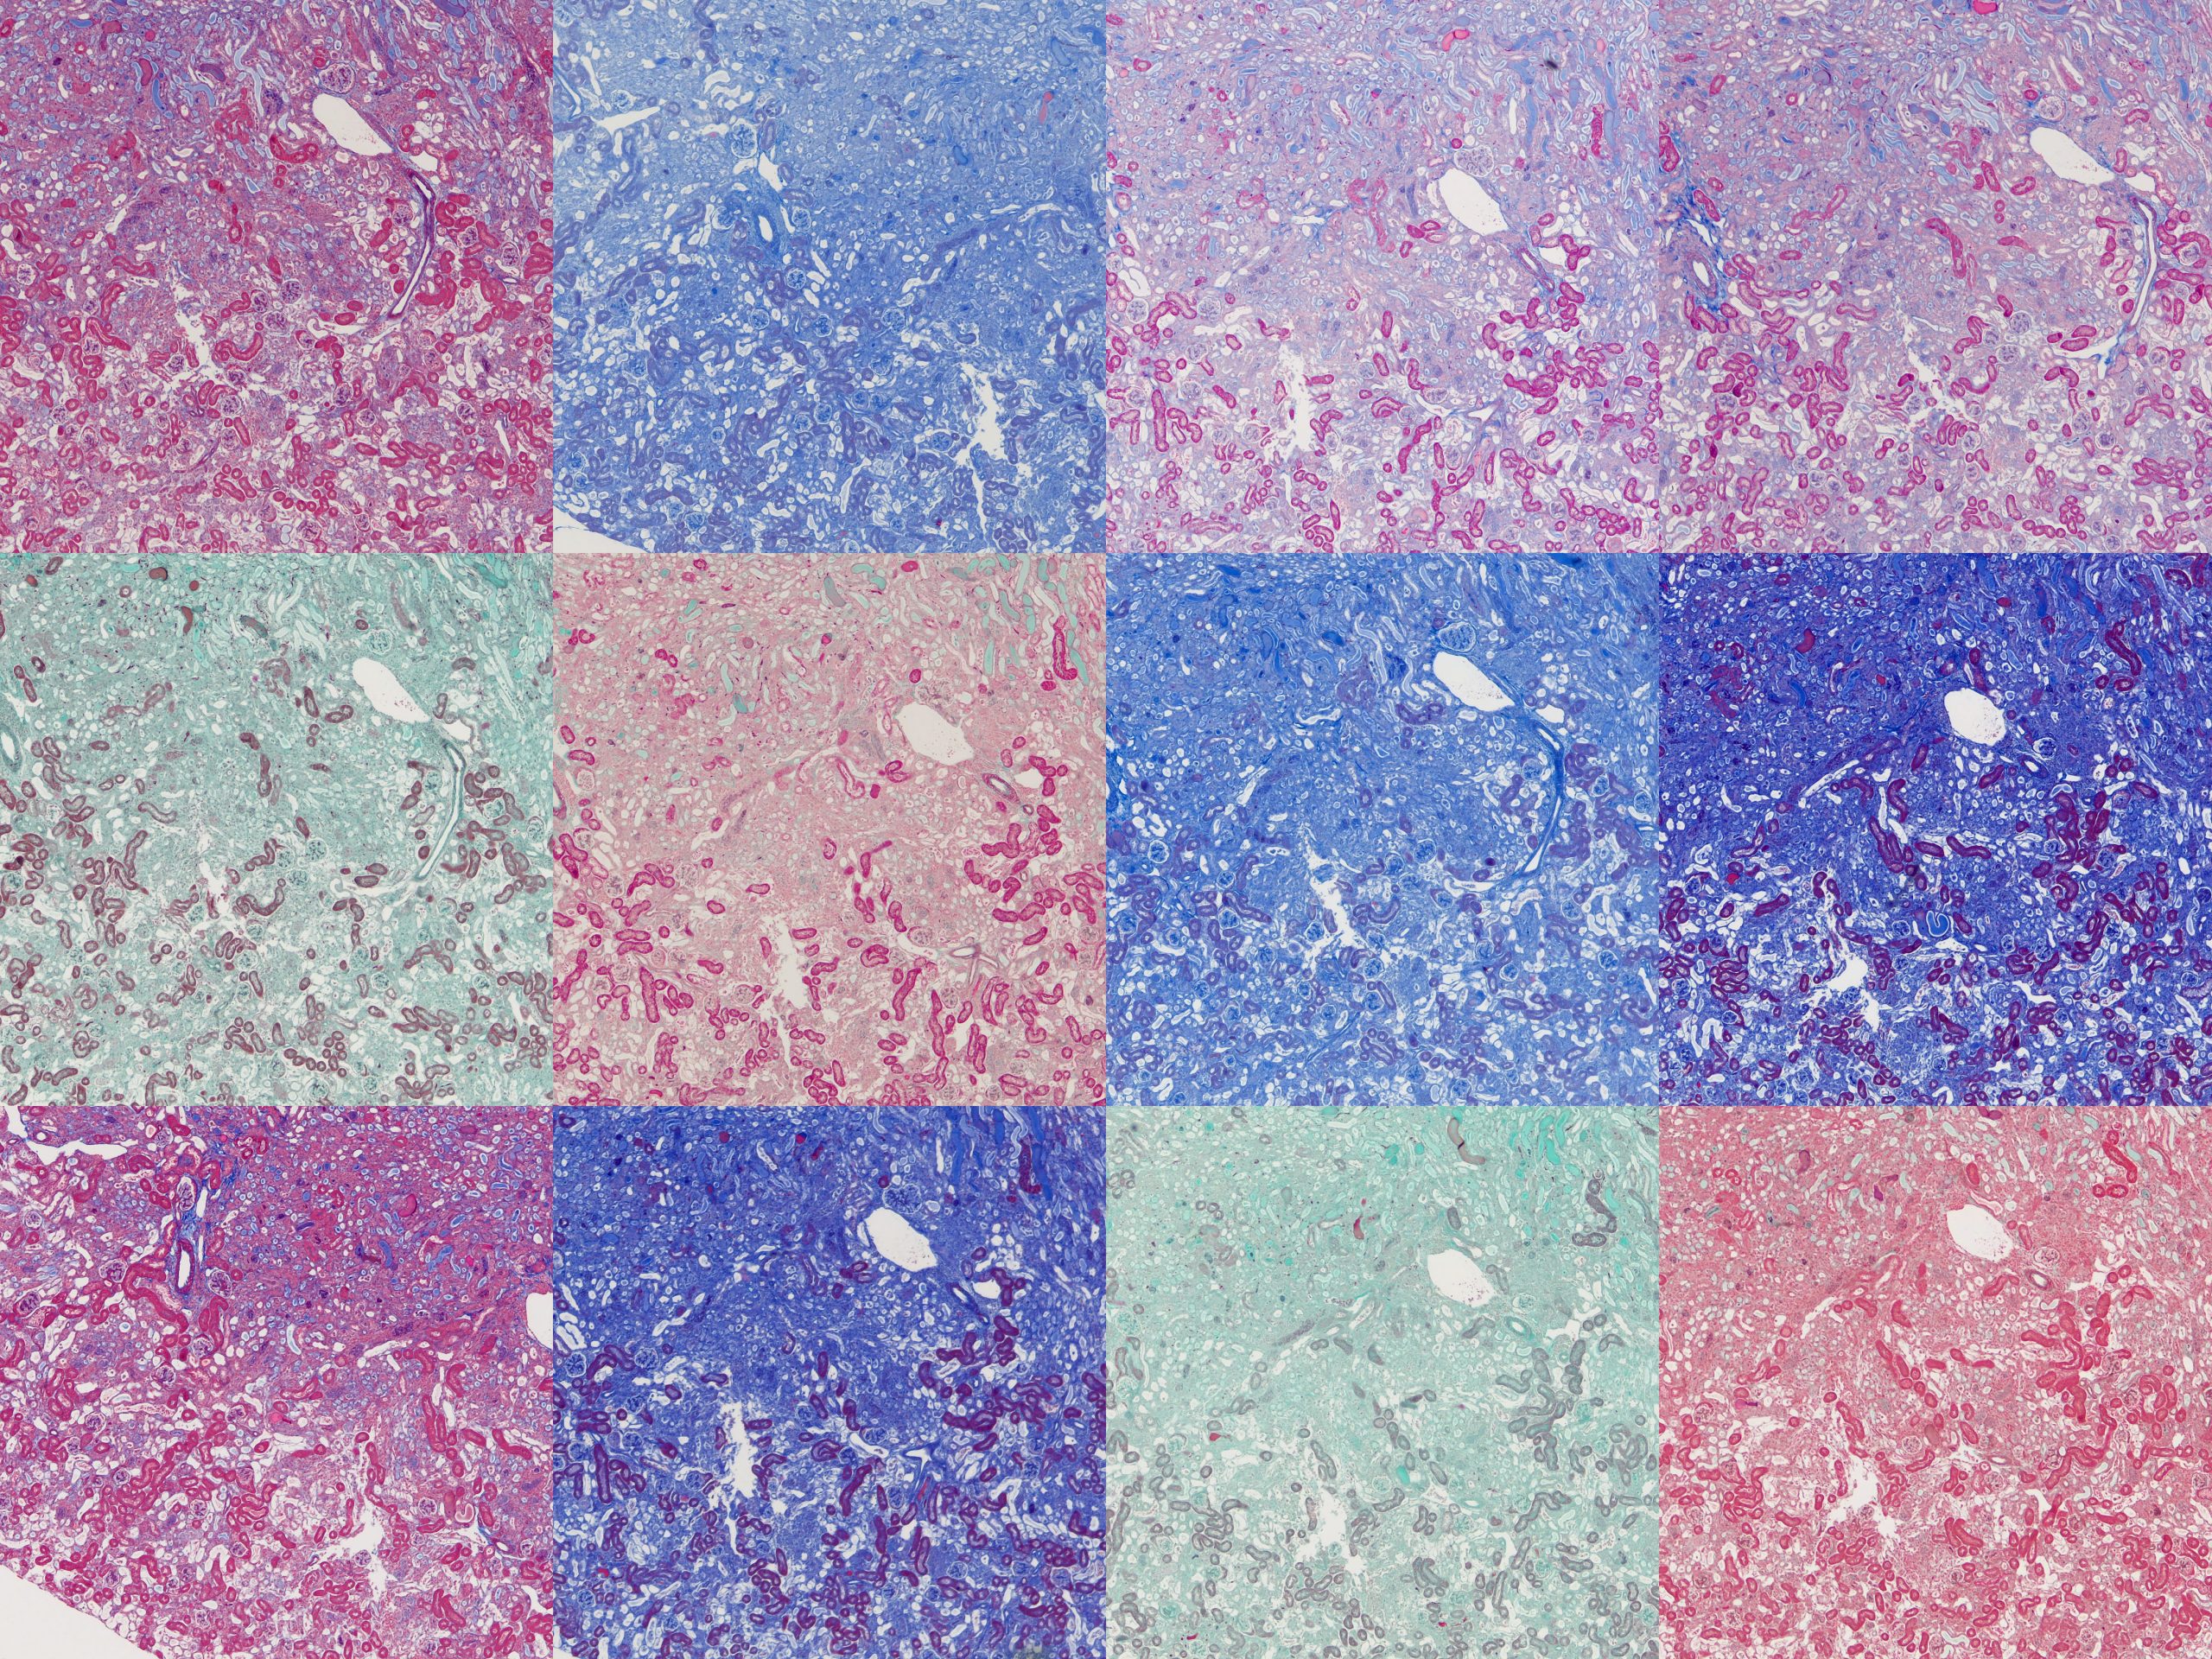
Finally, there’s something intriguing going on with fibrotic kidney compared to normal.
I’ve been running Masson’s trichrome staining to demonstrate fibrosis in a kidney model for research purposes. This is most visible in the lower left image above as areas of intense blue. The staining was often imperfect which is part of why I decided to investigate different protocols with the aim of finding an ideal one. Although it was chiefly the fibre stain that was of interest for these samples, performing these side-by-side comparisons is also showing something in the plasma stain.
In normal kidney the plasma stain is retained throughout and gives clear outlines of the architecture of the kidney. In diseased kidney it’s selectively retained only in certain structures. I’m not sure myself what these are but this could reflect some sort of biochemical change in the diseased kidney that gives some areas a much higher affinity for the plasma stain. Hard to say what this could be without further work to determine precisely what these structures are.
Next steps
The primary aim for these experiments was to discover the ideal Masson’s trichrome for kidney fibrosis. The best of these protocols still isn’t perfect. In particular there’s still a lot of background fibre staining that needs to be removed. The next step will be to take the best of these protocols and begin altering some of the other variables in the protocol. For example:
- Staining times
- Stain concentrations
- Differentiation time in phosphomolybdic acid
- Acetic acid treatment after fibre stain
- Swap phosphomolybdic acid to phosphotungstic acid or use a mix
There’s a lot of variables to play with.
Finally there’s the re-introduction of a nuclear counterstain. Quite a few options exist for this too but that’s something to consider once the fibre and plasma stains are perfect.
Acknowledgements
Thanks to Irina Grigorieva for input into the protocols and Anne-Catherine Raby for input and supplying the kidney tissue used.
