I get asked now and again for illustrations and images that I’ve made for various purposes. Here’s my attempt to make a few of them available. Most were composed using Photoshop, and the source files are available on request. They are completely free to use, edit or adapt for non-commercial purposes, providing credit is given (Chris North/Cardiff University), and that you also make what you produce freely available in a similar way (a CC-BY-NC-SA license).
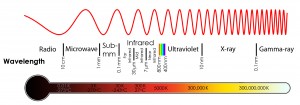
Electromagnetic spectrum
The EM spectrum with the boundaries between the common spectral regimes shown. Originally based on an image on Wikipedia.
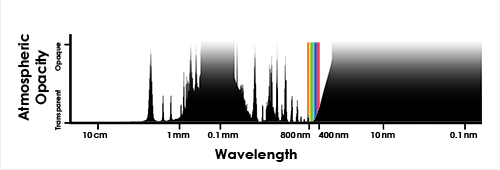
Atmospheric Transmission
A graph of the atmospheric opacity over wavelength, with the visible rainbow shown for reference.
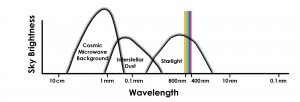
Sky brightness
The average sky brightness showing the optical emission from starlight, the far-infrared emission from thermal dust emission, and the cosmic microwave background. The wavelength scale is the same as the EM spectrum graph above.
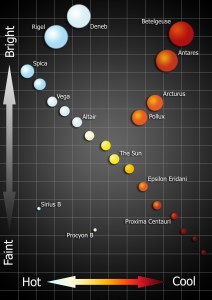
Hertzsprung-Russell Diagram
A “cartoon” of the Hertzsprung-Russell diagram, showing the brightness and temperature of stars. The main sequence, giant branches, and white dwarfs are shown. The diagram shows the position of real stars in the sky.
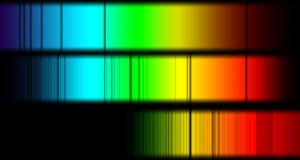
Stellar Spectra
Schematic cartoons and stellar aborption spectra, showing a blue giant star (A-type), the Sun (G-type) and a brown dwarf. The lines shown are only a tiny fraction of those that are visible with modern technology, but are the darkest lines. The A-type star shows fewer lines because it is so hot that many of the elements are fully ionised, so no absorption is possible. The brown dwarf star is much cooler, so shows molecular absorption lines as well as atomic transitions. This image was used in the June 2013 episode of The Sky at Night.
Comet Spectroscopy
An example of the positioning of a spectrograph slit along the tail of a comet. This was designed based on guidance from Alan Fitzsimmons, and used in the December 2013 episode of The Sky at Night, illustrating spectroscopy on the Isaac Newton Telescope.


