Data
The data (i.e. the images) used in Chromoscope is sourced from a number of sources, and used on Chromoscope with permission. Copyright still resides with the original image/data owners, so please contact them if you would like to use them elsewhere.
There are several methods of creating the tiles:
- Use the GMapImageCutter software.
- Use this perl script (originally written by Stuart Lowe)
- Use this python script (originally written by Chris North and Bob Watson, using the healpy library)
Visible
Visible light, sometimes called optical light, is the light we see with our eyes, and mainly shows stars, as well as ionised, or energised, clouds of gas, with the plane or our galaxy clearly visible across the middle. The dark regions in the Galactic Plane are being obscured by dust.

High-zoom:From the Digitized Sky Survey, which is a digitized catalogue of photographic plates originally observed with the UK Schmidt Telescope (in Australia) and the Palomar Observatory. The survey had three bands (red, blue and infrared), which produces a colour image. Since each tile was observed separately, the complete image has a “patchwork-like” appearance. The full-sky image was painstakingly stitched together by Stuart using images from WikiSky. Some bright stars have “ghost” images due to internal reflections within the original telescope optics, which are identifiable by for “cross” pattern that appears (due to the support holding the telescope optics in place.
View DSS2 in Chromoscope >

Low zoom:An all-sky image captured over many, many nights by astrophotographer Nick Risinger. To capture the full sky, Nick had to travel to a number of sites in the US and South Africa.
View SkySurvey in Chromoscope >
Hydrogen alpha
This shows hot ionised hydrogen gas, and has the appearance of bubbles distributed across the sky. The bubbles are being blown by hot, young stars, and by old stars as they end their lives. Hydrogen-alpha describes the particular wavelength of light (a particular colour in the red part of the spectrum, specifically 656.28 nm) that is emitted by hot ionised hydrogen gas as electrons move between energy levels. The data used in Chromoscope was produced by Doug Finkbeiner, using data from three surveys (WHAM, VTSS and SHASSA) that, between them, cover the whole sky. The full-sky maps are available at skymaps.info.
View Hydrogen-alpha in Chromoscope >
Near-infrared
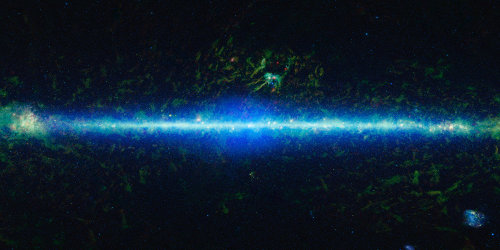
Near infrared light has a slightly longer wavelength than visible light, and shows cooler objects. The image in Chromoscope is the all-sky image from the WISE satellite. Colour scheme: blue (wavelength 3.4 µm) shows cooler stars in our galaxy and in nearby galaxies, while green (12 µm) and red (24 µm) show warm dust.
View Near-infrared in Chromoscope >
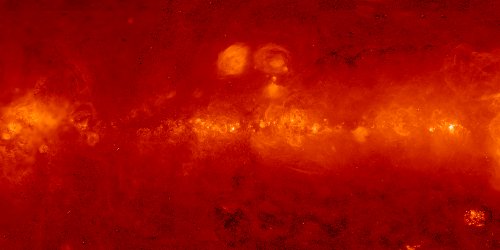
Far-infrared

Far-infrared light, with a much longer wavelength than visible light, shows cold dust between the stars. Although there are a number of notable clumps, which are dense regions where stars are forming, most of it is distributed across the sky as “galactic cirrus”. The image in Chromoscope is the all-sky image from the IRAS satellite, showing far-infrared light at a wavelength of 100 µm. The image has had “zodiacal light” (which is due to dust in our own Solar System) and small, point-like sources (normally other galaxies) removed.
View Far-infrared in Chromoscope >
Microwave
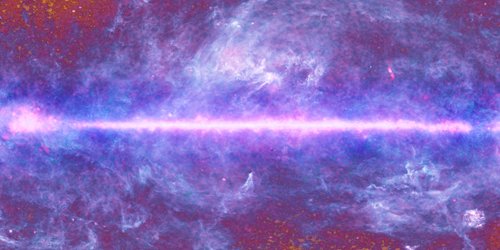
The microwave image in Chromoscope is from the Planck satellite, and covers a very wide range of wavelengths. In the background, towards the top and bottom of the image (i.e. out of the Galactic Plane), and shown as red and yellow splodges, is the light from the early Universe – the Cosmic Microwave Background. With a wavelength of around 2mm, this is the afterglow of the Big Bang, and the structures are the tiny variations in temperature and density that tell us so much about the structure and early evolution of the Universe. In the foreground is light from our galaxy, as well as nearby neighbours. The blue colours (wavelengths less than a millimetre), are emitted by cold dust, and have a structure similar to the far-infrared image. The pink-ish glow is light with a wavelength of about 1cm, and is emitted by both hot gas, and should show similarities to the Hydrogen-alpha image.
View Microwave in Chromoscope >
Neutral Hydrogen

Cold hydrogen gas doesn’t emit much light at any wavelength, despite being the most abundant substance out in space. However, there is one particular wavelength at which it does emit: 21cm radio emission. The emission is actually caused by the quantum spin of the electron in the atom flipping relative to the proton, called a “hyperfine transition”. Although this happens randomly, it isn’t a very common transition, so the emission is fairly faint. With developments in radio receiver technology, increased computational power, and the commitment of a worldwide team of astronomers, it is now possible to map the coldest parts of the galaxy at a higher resolution than was previously possible. The data in Chromoscope is from the HI4PI survey, which used the 100m Effelsberg telescope (in Germany) and the 64m Parkes telescope (in Australia) to map the sky at this wavelength.
View Neutral Hydrogen in Chromoscope >
Radio
Although radio waves are long wavelength, and therefore low energy, they are emitted by some very energetic processes. Most of the radio waves seen in Chromoscope are due to very fast-moving electrons spiralling around magnetic fields. They show emission from material near black holes at the heart of distant galaxies, as well as loops that outline the bubbles blown by exploding stars. The data in Chromoscope is from the “Haslam” survey of radio waves at a frequency of 408 MHz (corresponding to a wavelength of around 75cm), which used the 64m Parkes Telescope in Austrialia and the 76m Lovell Telescope at Jodrell Bank in the UK. Despite their impressive sizes, the long wavelength of the radio waves means that the resolution is relatively poor, and has been further smoothed to make the image easier to interpret.
View Radio Waves in Chromoscope >
X-ray
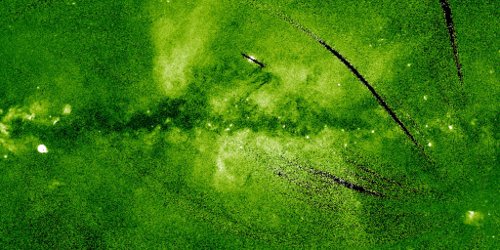
X-rays are emitted by some of the most extreme events in the Universe, from the hot remnants of exploded stars, to the bright hearts of distant galaxies, to the hot gas being accreted by neutron stars and black holes in binary star systems. The x-ray observations in Chromoscope are from the German ROSAT satellite, and are incredibly noisy – hence the “speckled” appearance. The black stripes are due to the satellite not returning any data for those parts of the sky, or being saturated due to very bright sources.
View X-rays in Chromoscope >
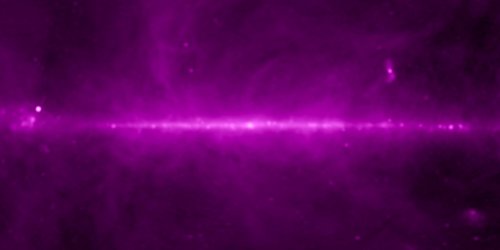
Gamma ray
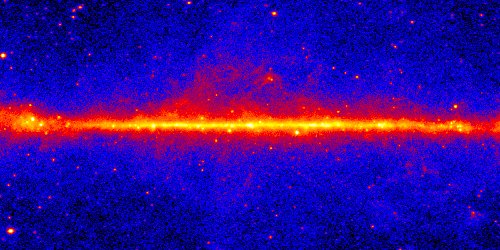
The most energetic wavelengths of light we can detect are called gamma rays, and are emitted by material at millions of degrees. This can be from the hearts of galaxies, the surroundings of rapidly rotating neutron stars, or from the most violent explosions ever observed, called gamma-ray bursts. NASA’s Fermi satellite observes gamma rays over the whole sky, showing emission from gamma rays up to energies of 300 GeV (100 billion times more energetic than visible light).
View Gamma rays in Chromoscope >
How did we make the images?
Some of the wavelengths are available as full-sky images, while others have to be constructed from astronomical data. We made extensive use of the HEALPix software library to make and plot full-sky images, some of which were colourised using GIMP and Adobe PhotoShop. Since there is a practical limit to how large these files can be, the resolution limit of Chromoscope is around 1 arcminute, so some wavelengths (notably optical) are not shown at their full resolution.
Once the full-sky images have been created, they then have to be split into tiles at a range of zoom levels, for which we used the GMap Image Cutter from UCL (available for academic purposes here). Alternatively, you can use the cutter.pl perl script written by Chromoscope developer Stuart Lowe.
Where can I get the tilesets?
The tilesets and images are available for download should you need them for a local version. Please note that copyright still resides with the original image/data owners, who have a variety of licence conditions, so please contact them if you would like to use them outside of the Chromoscope context.