Data analysis by students
9 July 2015As part of the work experience week, we host students from Secondary Schools and Colleges from various parts of South Wales. It’s a large scheme called Science in Health Work Experience 2015 that hosts more than 50 students in the School of Medicine. It’s organised by Dr James Matthews who does a great job leading the programme.
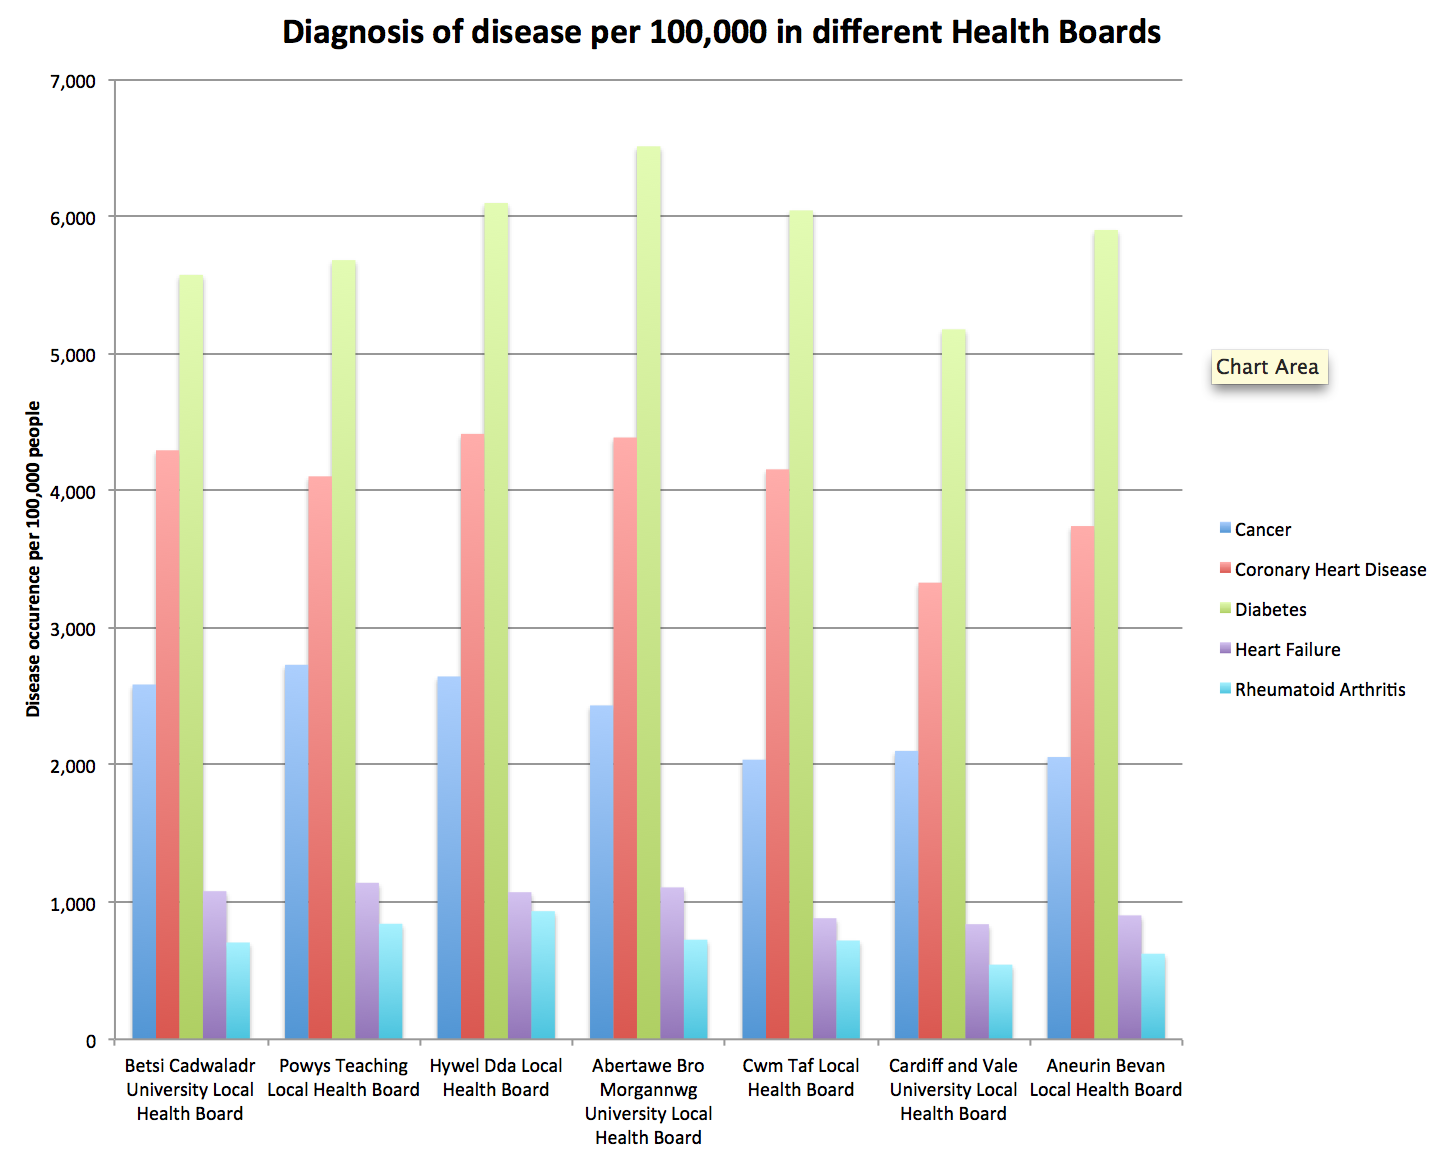
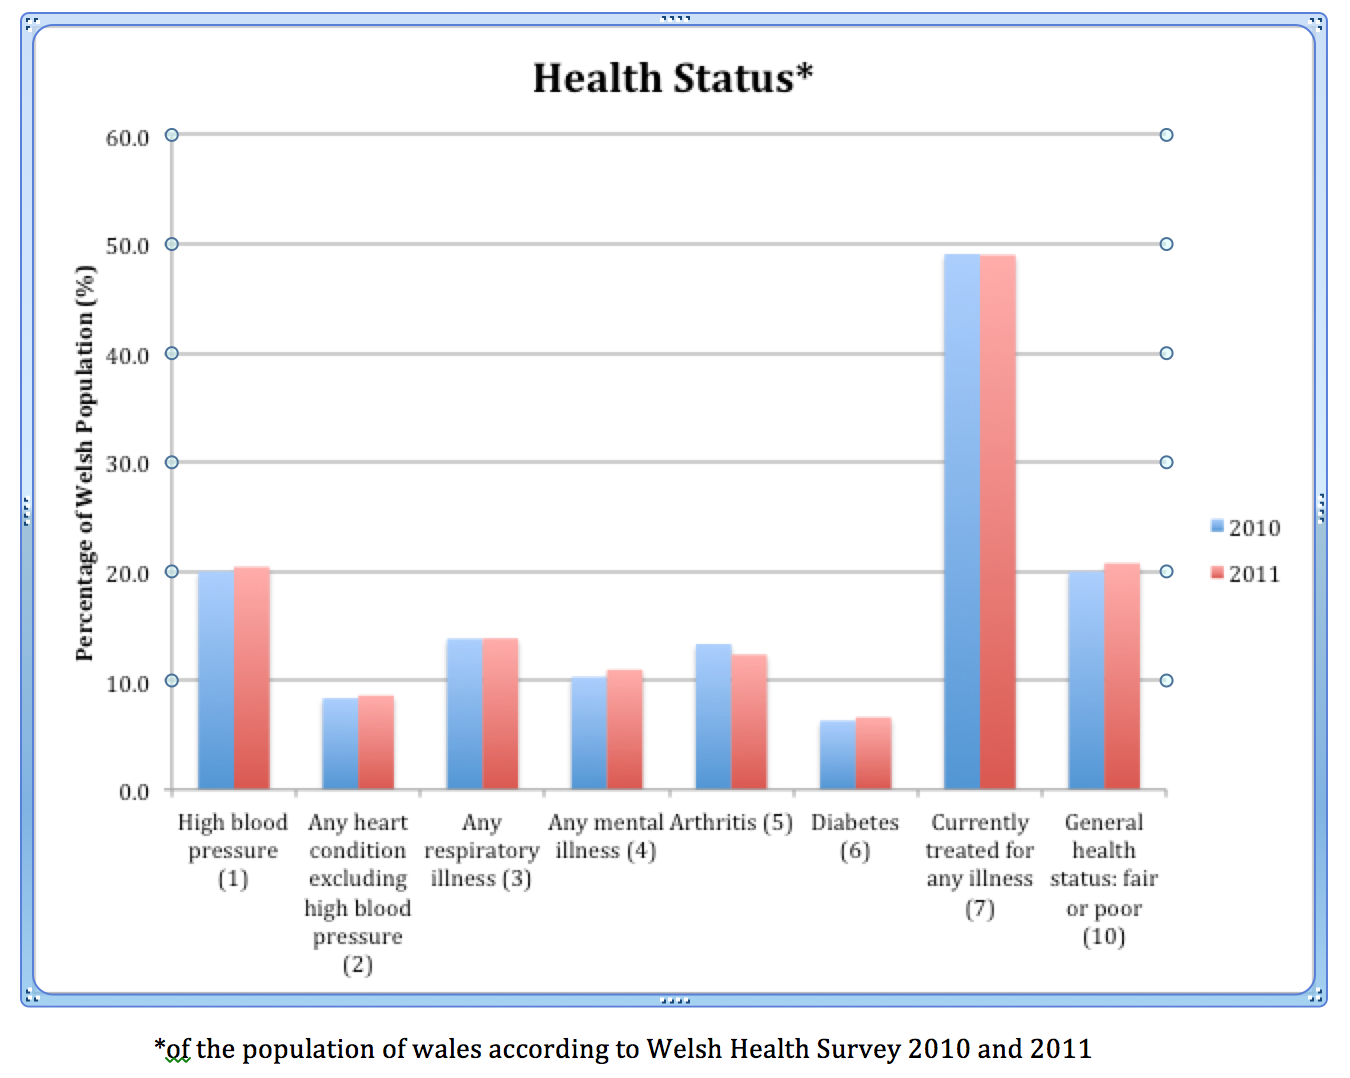
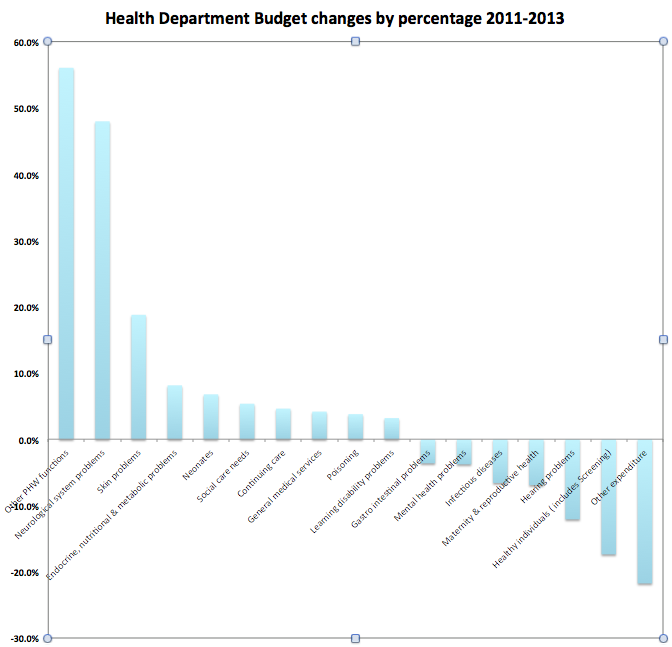
During the day, we show the students the processing we do using CLL blood samples, we discuss leukaemia, biochemistry, medicine and career opportunities. I’ve also been encouraging them to play with some of the data available about the health of the people of Wales. They enjoyed seeing real samples in a real lab. Thanks to Shimaz and Reiss for doing that.
The students use Excel for their data analysis and use data from StatWales the latest Welsh Health Survey. I ask the students to download some data and draw a graph that interests them. The students were Taegan, Amelia, Will, Lowri, Rachael, and Asif. Here are some of the graphs that they drew (I haven’t checked them all but they’re interesting:

- June 2024
- May 2023
- September 2022
- August 2022
- February 2022
- January 2022
- November 2021
- November 2020
- September 2020
- July 2020
- June 2020
- May 2020
- November 2019
- June 2019
- May 2019
- December 2018
- June 2018
- November 2017
- June 2017
- July 2016
- June 2016
- April 2016
- October 2015
- July 2015
- April 2015
- March 2015
- February 2015
- January 2015
- November 2014
- October 2014
- August 2014
- March 2014
- November 2013
- August 2013
- July 2013