Have you ever wondered what happens to the different stars in the night sky as they get older? This activity lets you explore the life-cycle of stars and is linked directly to Secondary School curriculum on this topic.
Paper-based Hertzsprung-Russell Diagram (age 12-16)
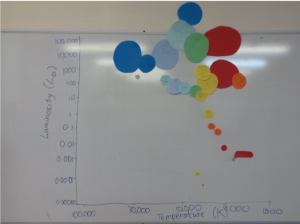
 In this activity students create their own Hertzspring-Russell diagram based on real star data. After being assigned a star, students cut out a circle of coloured paper (size related to radius and colour related to temperature) and place them on a pre-prepared plot. The result can be laid out on a table, on the floor or stuck onto a wall or whiteboard.
To use this activity in the classroom you will need: coloured paper/card (white, blue,yellow, orange, red), scissors, rulers or compasses, sticky tack, x30 prints of HR Diagram Activity, a print(s) or display of ‘The colours of stars’, axis either drawn on or from ‘printable axis labels’.
- HR Diagram Activity
- The Colour of Stars
- Printable axis labels
- Cover Sheet for Teachers (paper based) [.docx]
- Cover Sheet for Teachers (paper based) [.pdf]
- Powerpoint for Teachers [.pptx]
There are additional resources on the LCO Star in a Box page, including a summary and walkthrough of a similar session.
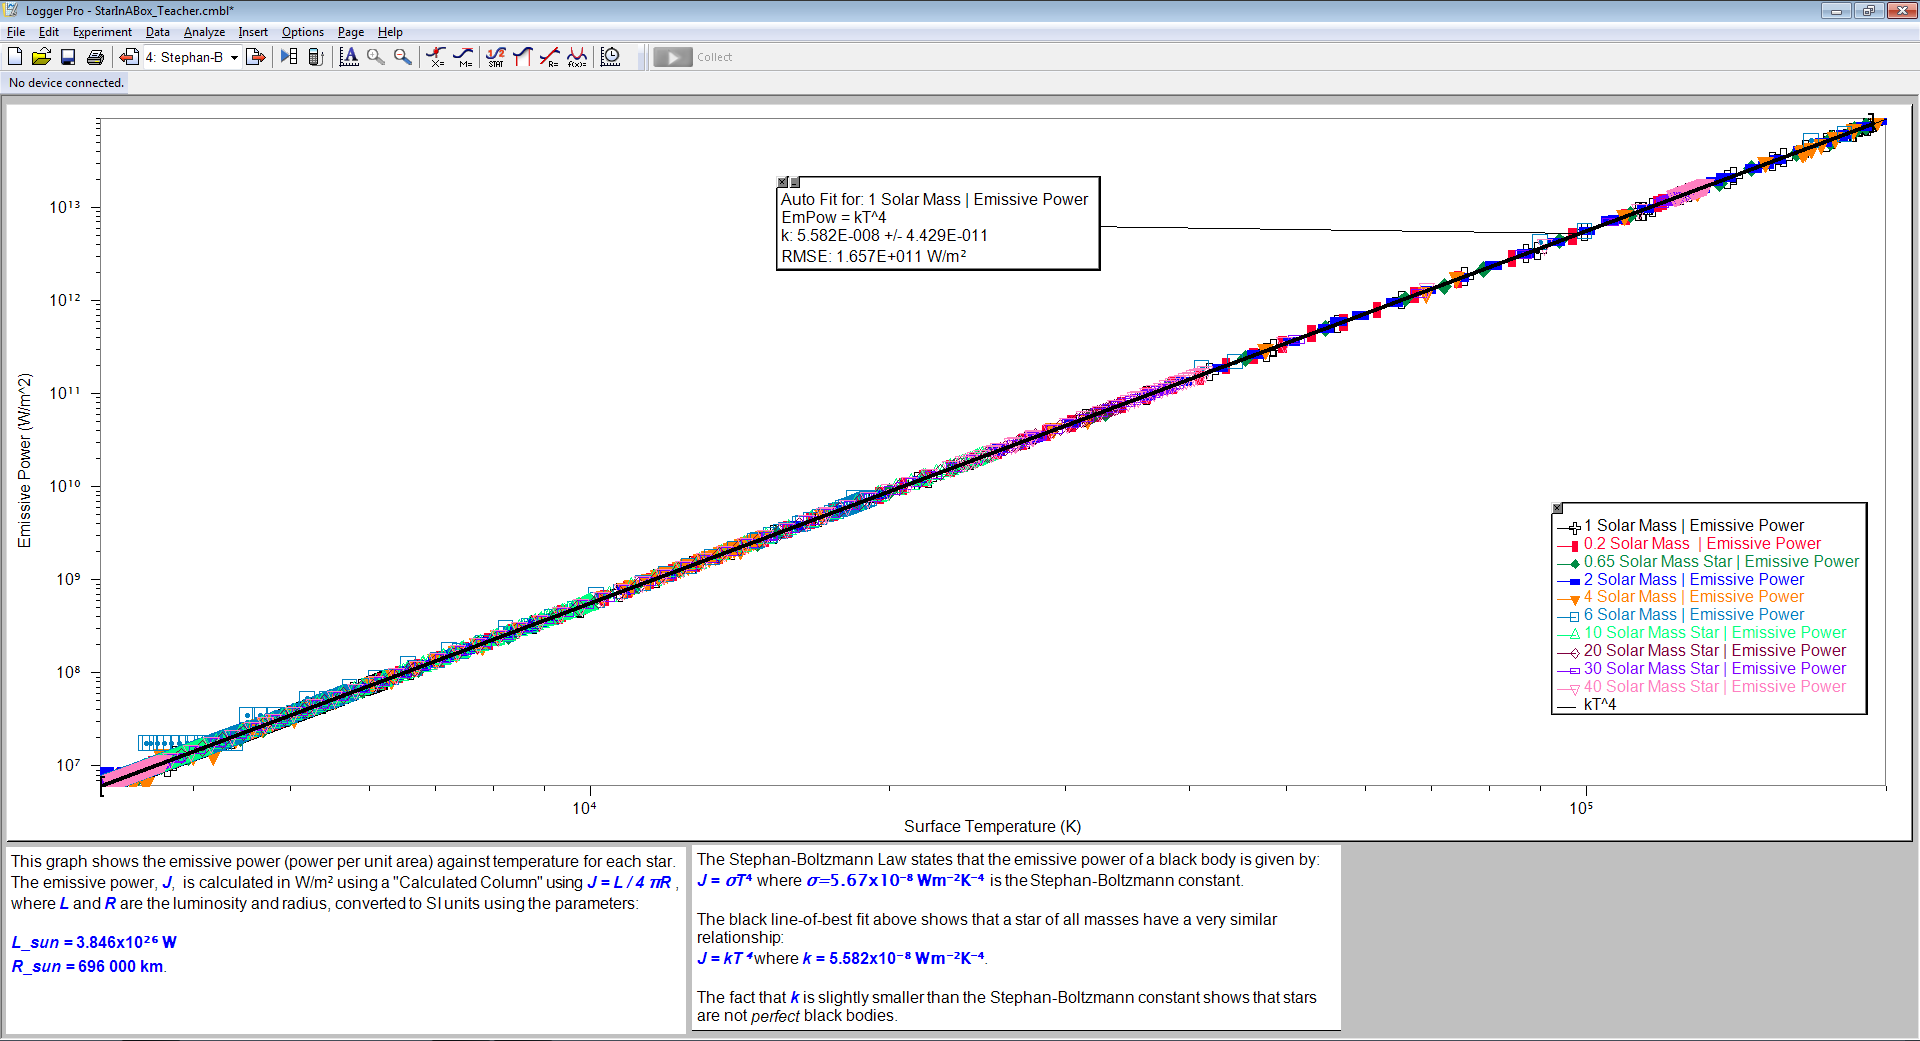
Steffan-Boltzman Law (16-18)
Using data about stars above , it is possible to explore the Steffan-Boltzmann Law. Students need to convert the luminosity and radius into SI units, and then calculate emissive power (power/unit area). Plotting that against temperature (on a log-log) plot, allows them to construct their own Steffan-Boltzmann law.
Star in a Box
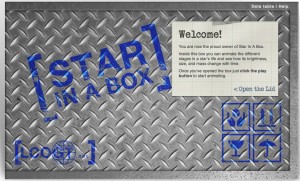
Star in a Box is an interactive webapp which animates stars with different starting masses as they change during their lives. Some stars live fast-paced, dramatic lives, others change very little for billions of years. The webapp created by Las Cumbres Observatory and Cardiff University astronomers (with funding support from a public engagement grant from STFC and the National Science Academy of Wales), allows students to visualize the changes in mass, size, brightness and temperature of stars for all these different stages.
Resources for Lessons Based on Star in a Box
Here we provide some materials for teachers directly linked to the Lifecycle of Stars topic, to use Star in a Box in the classroom including powerpoint files, worksheets and cover sheets for Schemes of Work. These materials have been created with local teachers (with thanks to undergraduate student Megan Davies) to link directly to the curriculum.
KS3/GCSE resources
- Cover Sheet for Teachers [.docx]
- Some example stars [.xlsx]
- Powerpoint for Teachers [.pptx]
- Worksheet for Students [.docx]
- Worksheet for Students [.pdf]
- Worksheet for Students (Answers) [.docx]
- Worksheet for Students (Answers) [.pdf]
A Level resources
- Cover Sheet for Teachers [.docx]
- Some example stars [.xlsx]
- Powerpoint for Teachers [.pptx]
- Worksheet for Students [.docx]
- Worksheet for Students [.pdf]
- Worksheet for Students (Answers) [.docx]
- Worksheet for Students (Answers) [.pdf]
Excel files
The files below allow the Star in a Box data to be studied and analysed in Microsoft Excel.
There are two student versions, both of which require the students to plot the graphs (instructions are provided within the files). One has additional columns of data already present, for the purposes of studying the Stephan-Boltzmann Law and energy conversion rate, while the other will require the students to calculate the variables (instructions provided). The teacher version has the graphs plotted.
- Student version without additional values calculated (no graphs plotted)
- Student version with additional values calculated (no graphs plotted)
- Teacher version with additional values calculated (all data plotted)
Logger Pro files
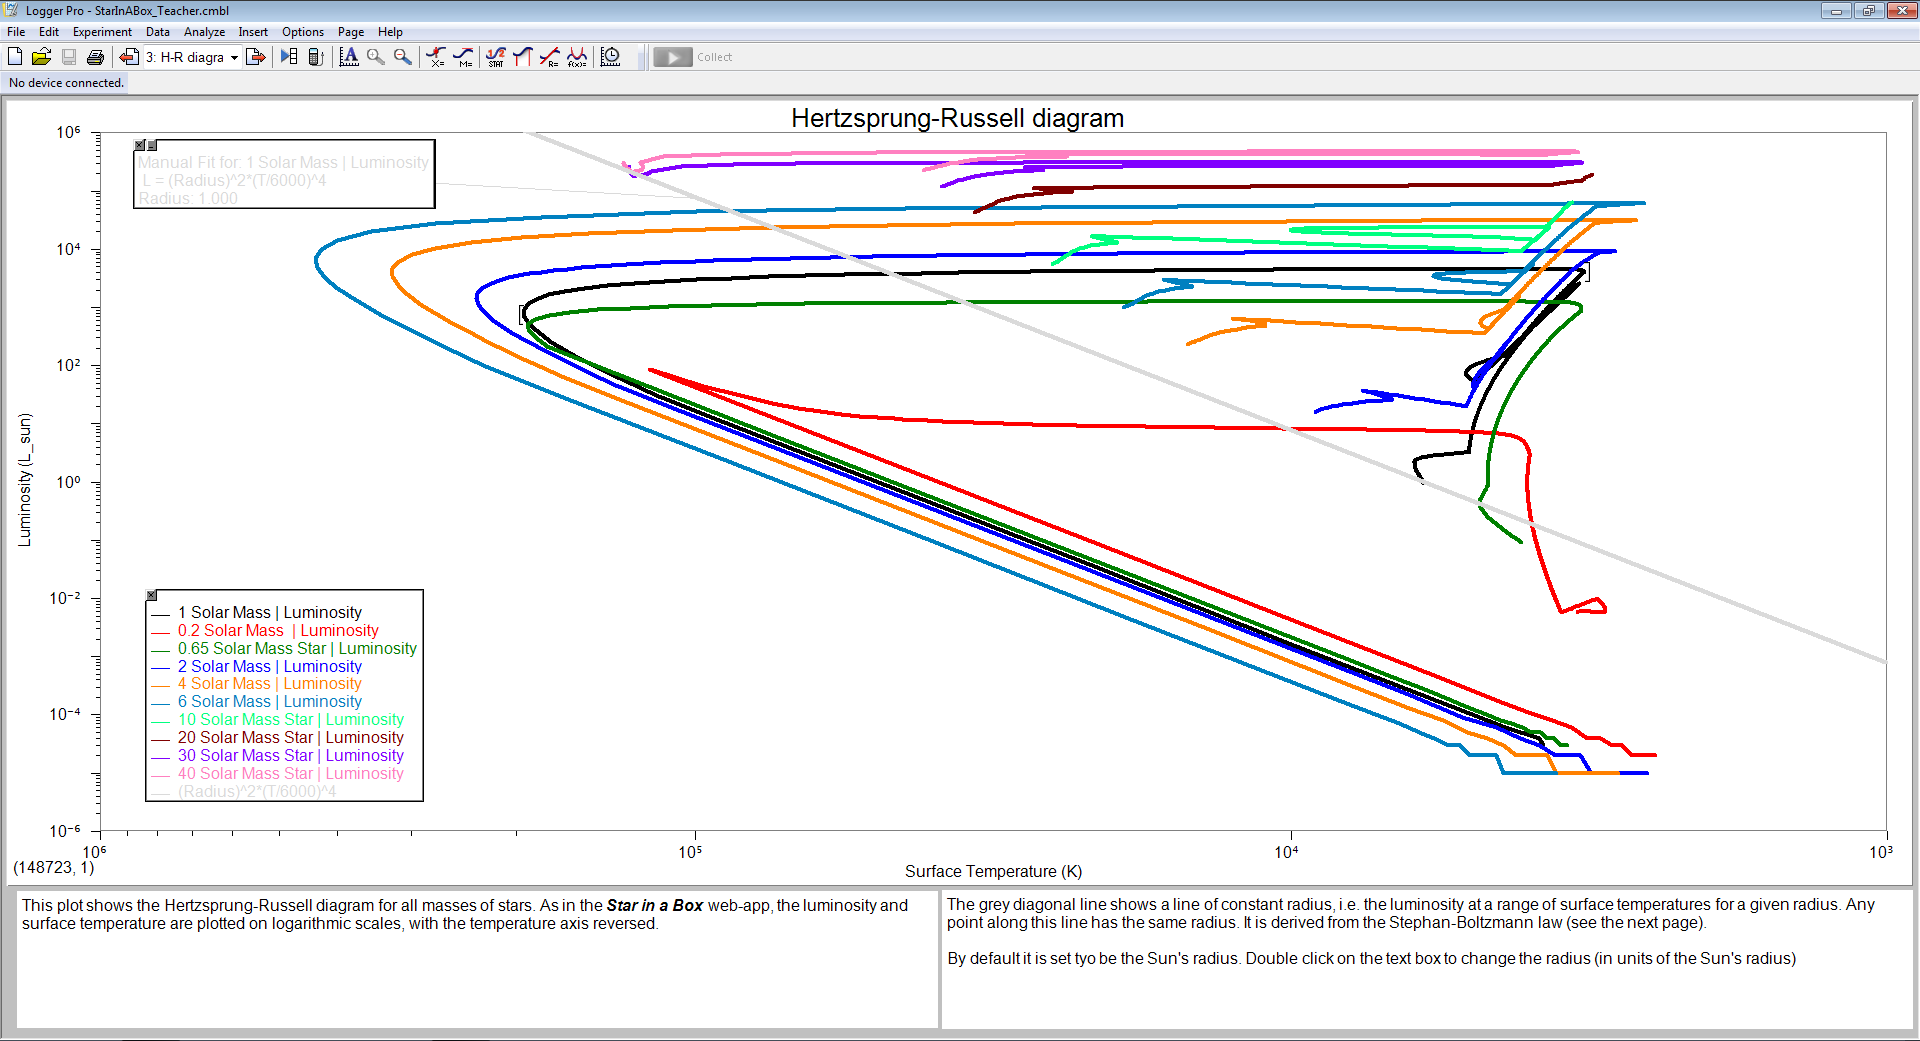
The files below contain the data from the simulations used in “Star in a Box”, which can be used as an alternative to analysis in Microsoft Excel. Developed as part of the Inspiring Science Education project they will open in Logger Pro, commercial software through which, students can easily plot graphs, calculate additional values, analyse the data, and conduct their own investigations.
There are two student versions, both of which require the students to plot the graphs (instructions are provided within the files). One has additional columns of data already present, for the purposes of studying the Stephan-Boltzmann Law and energy conversion rate, while the other will require the students to calculate the variables (instructions provided). The teacher version has the graphs plotted
- Student version without additional values calculated (no graphs plotted)
- Student version with additional values calculated (no graphs plotted)
- Teacher version with additional values calculated (all data plotted)
Other resources
There are additional resources on the LCO Star in a Box page, including a summary and walkthrough of the session.
Star in a Box is also available on astroEDU: Gomez, E., 2013, Star in a Box: High School, astroEDU, 1302 (doi:10.14586/astroedu.1302)